Usage Guides
Platforms
Selection
On the home screen of the application, once you are logged in there will be a page with all of your accessible Platforms.
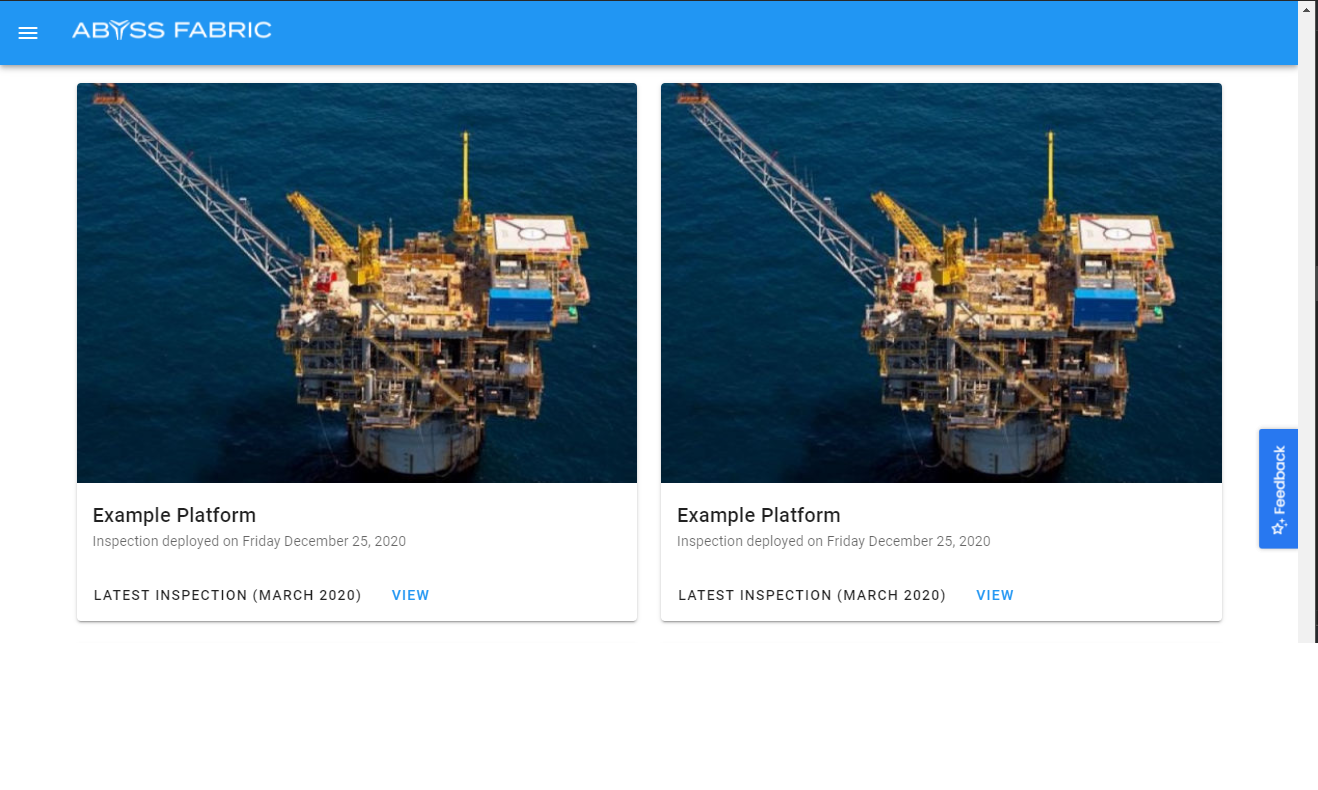
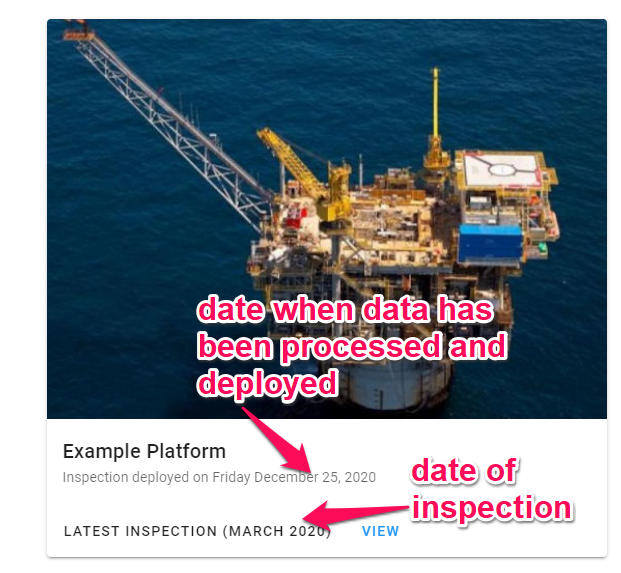
Each tile contains information about the date of platform inspection and data deployment.
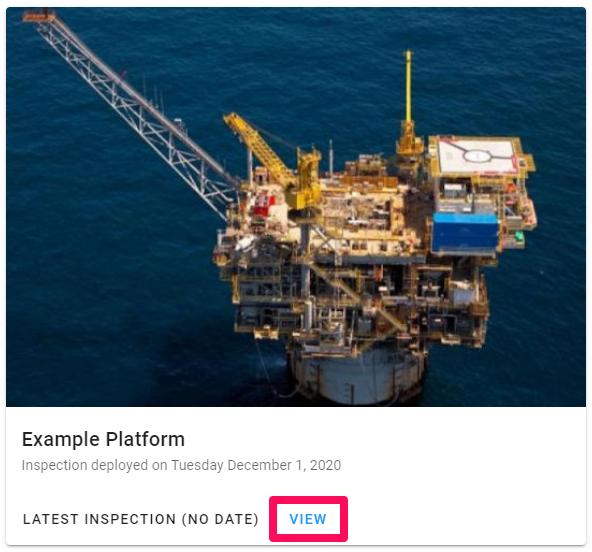
To Access the Platform View of a Platform click the VIEW button.
Platform View
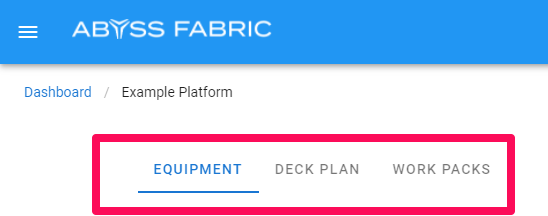
The platform view has different sections that can be accessed using the heading tabs.
There are three sections that you can access from the headings.
Equipment - detailed information about equipment on the platform.
Deck Plan - a deck plan viewer showing the deck layouts, with links to spherical images.
Work Packs - a work pack manager view, allowing the management and tracking of remediation work.
Equipment
Facility Health
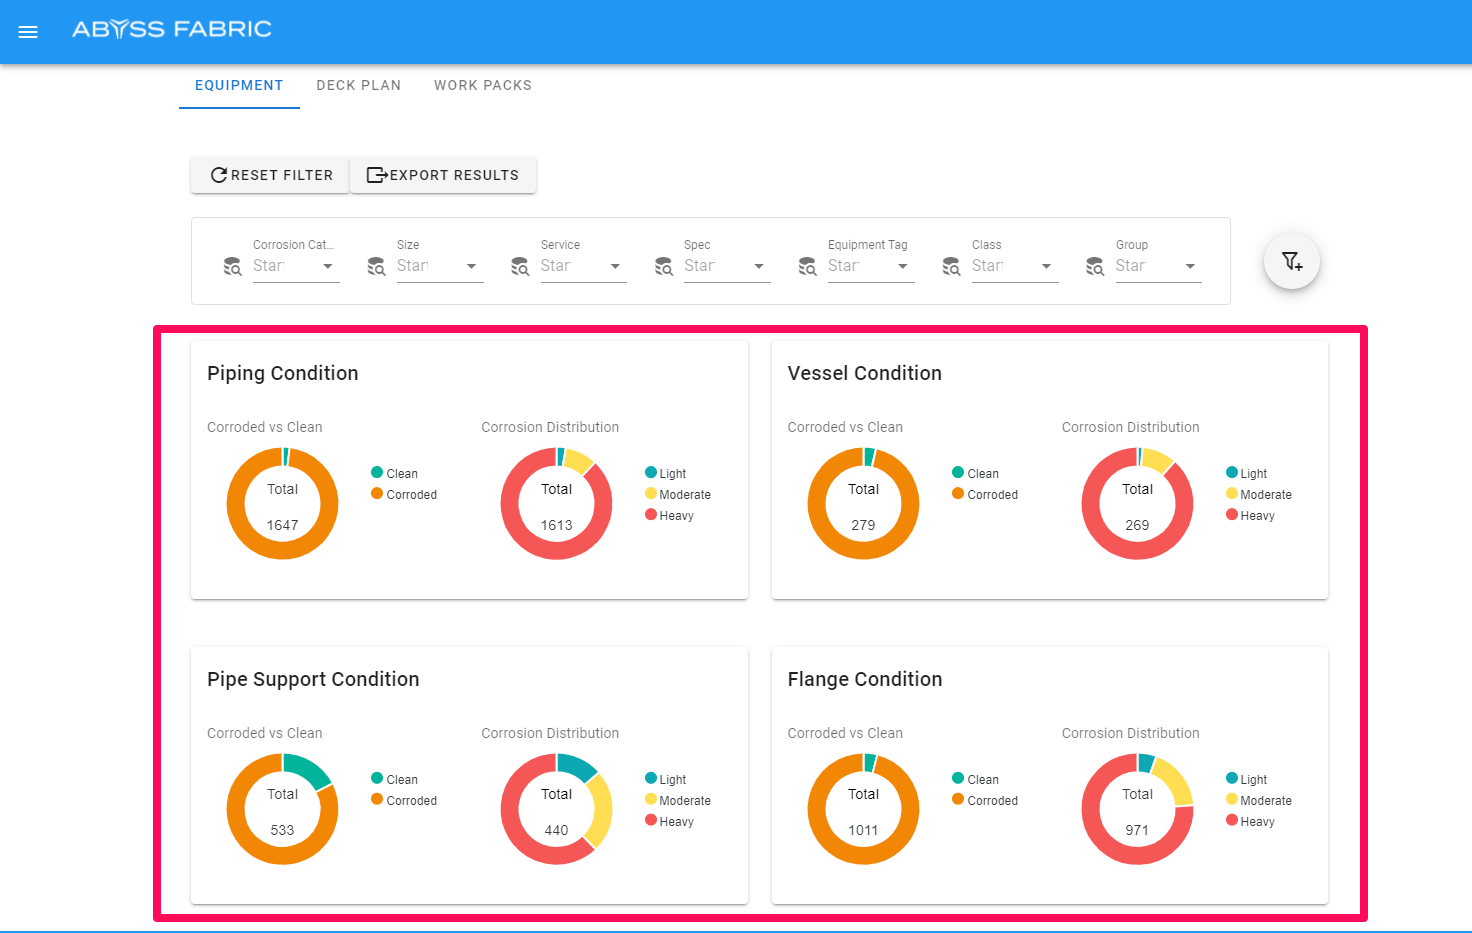
Overall facility health can be viewed at a glance with charts showing a summary of the corrosion health of major component categories on the platform.
Facility health is segmented into four categories which are separated by part type. These parts are further segmented according to the corrosion severity of the part.
Equipment Details
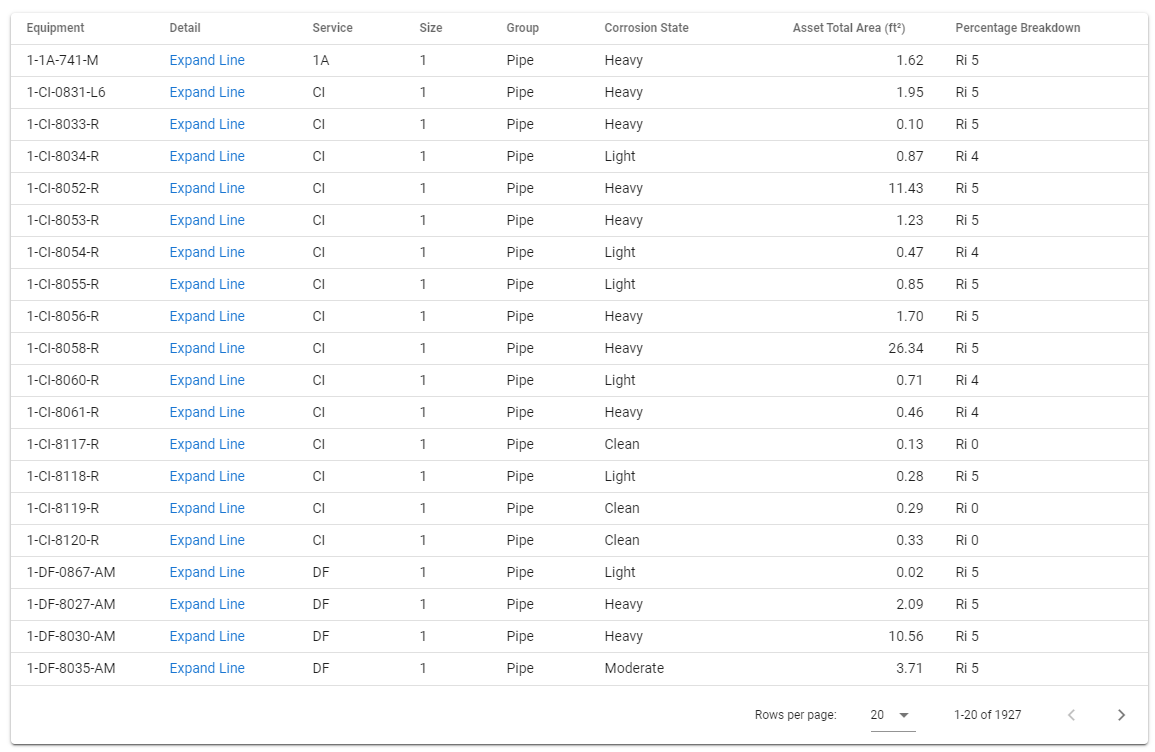
Below the Facility Health you can view corrosion state by individual line and pressure vessel number.
There are some standardized fields and some customizable fields in the equipment table.
Standardized Fields:
Equipment - based on line/vessel number in P&IDs
Detail - clicking on the detail on a line will show all of the parts on the line, allowing you to select images where the part is visible.
Corrosion state - describes the level of corrosion on the line, the level of corrosion for each label will be based on the client standard and framework agreed upon with Abyss.
Customized Fields will be described according to the framework agreed upon with Abyss.
Number of rows
The number of displayed rows on the table can be edited by using the dropdown at the bottom of the table.

Ranking / Sorting
It is possible to rank/sort your results using various metrics by clicking one of the table headers.

Filtering
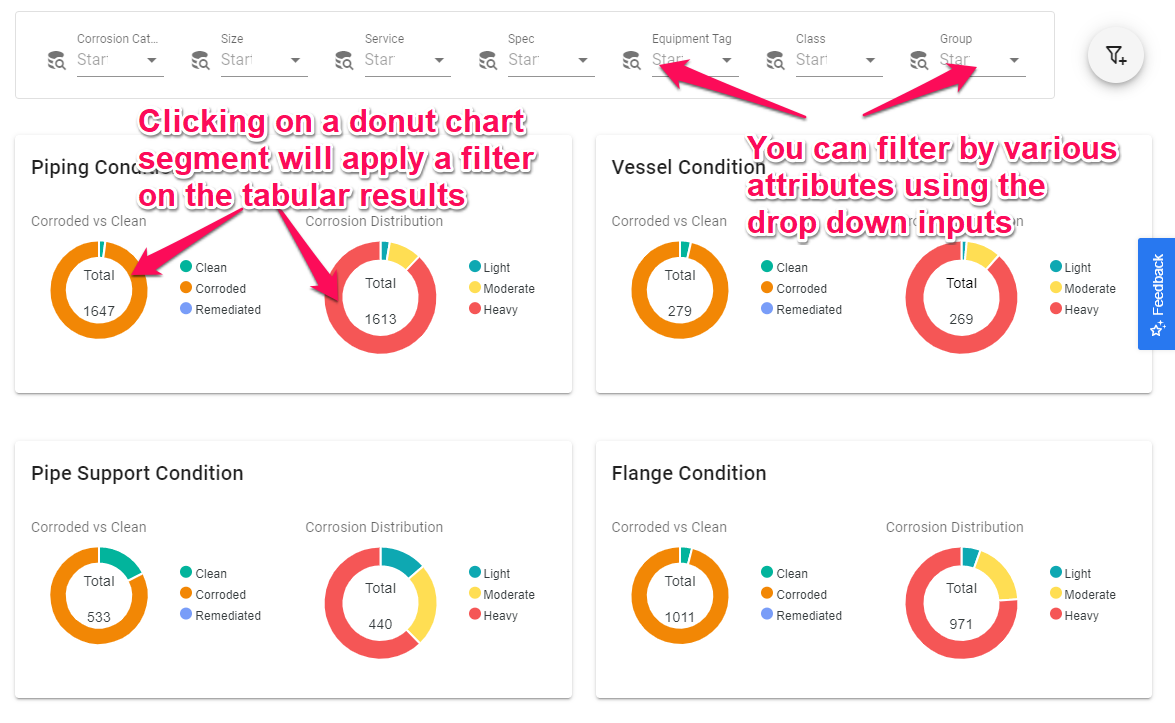
It is possible to filter lists by component and corrosion state from the summary above.
This can be done by either selecting a segment of the donut graph or by using the filter inputs.
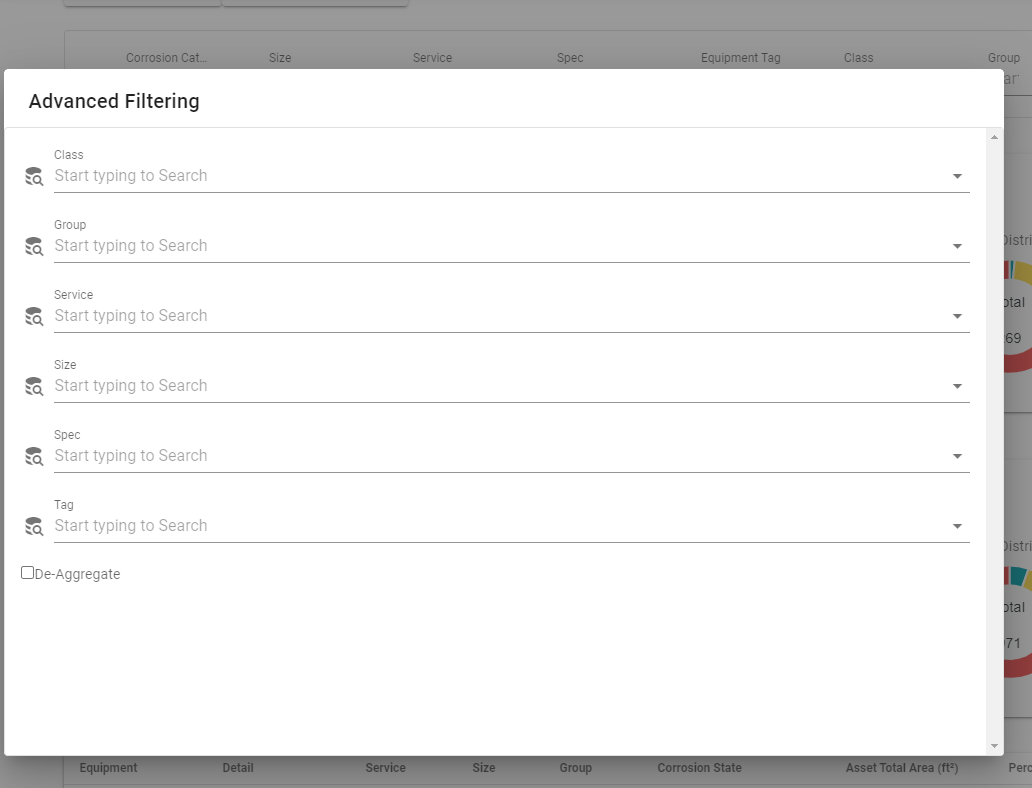
You can also access the advanced filters by clicking the Advanced Filter button.

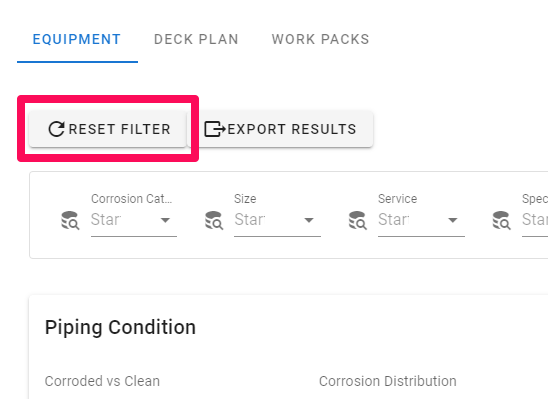
You can reset your filters by clicking the reset filters button.
Line Parts
To view Parts on a Line you can click the expand line button which will update the table.
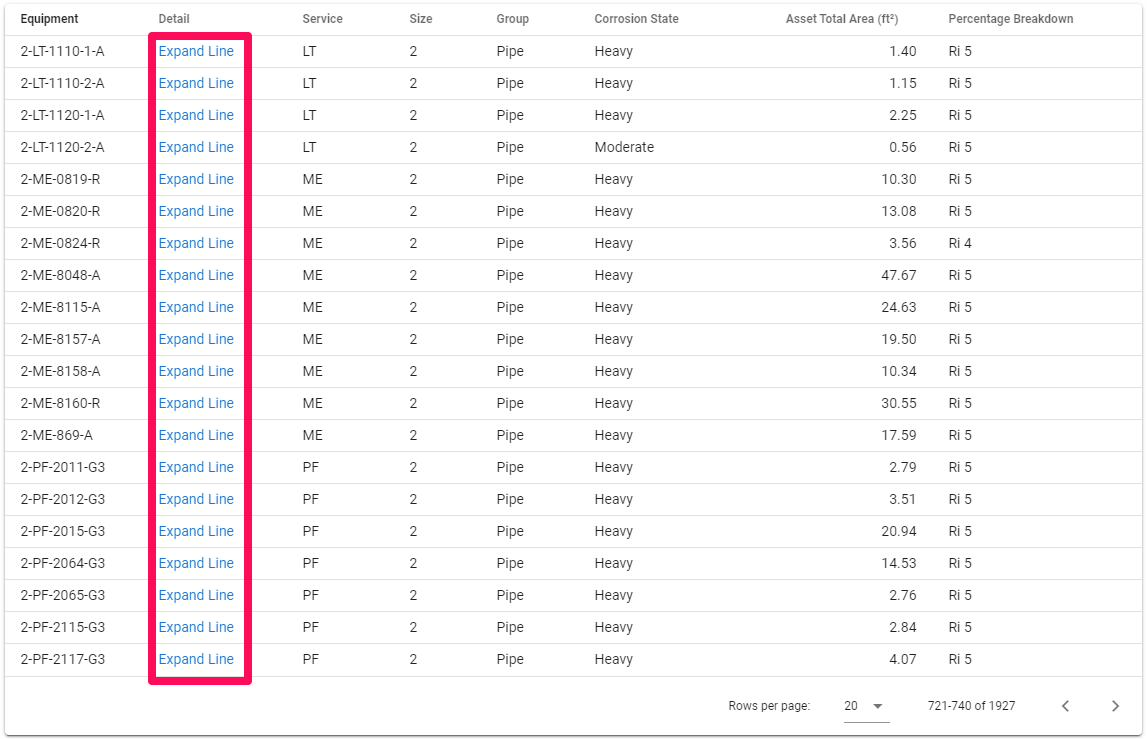
Each row represents an individual part on a line. Selecting a row will take you to a new view that has the Parts on the line. These can also be sorted.

Part Information
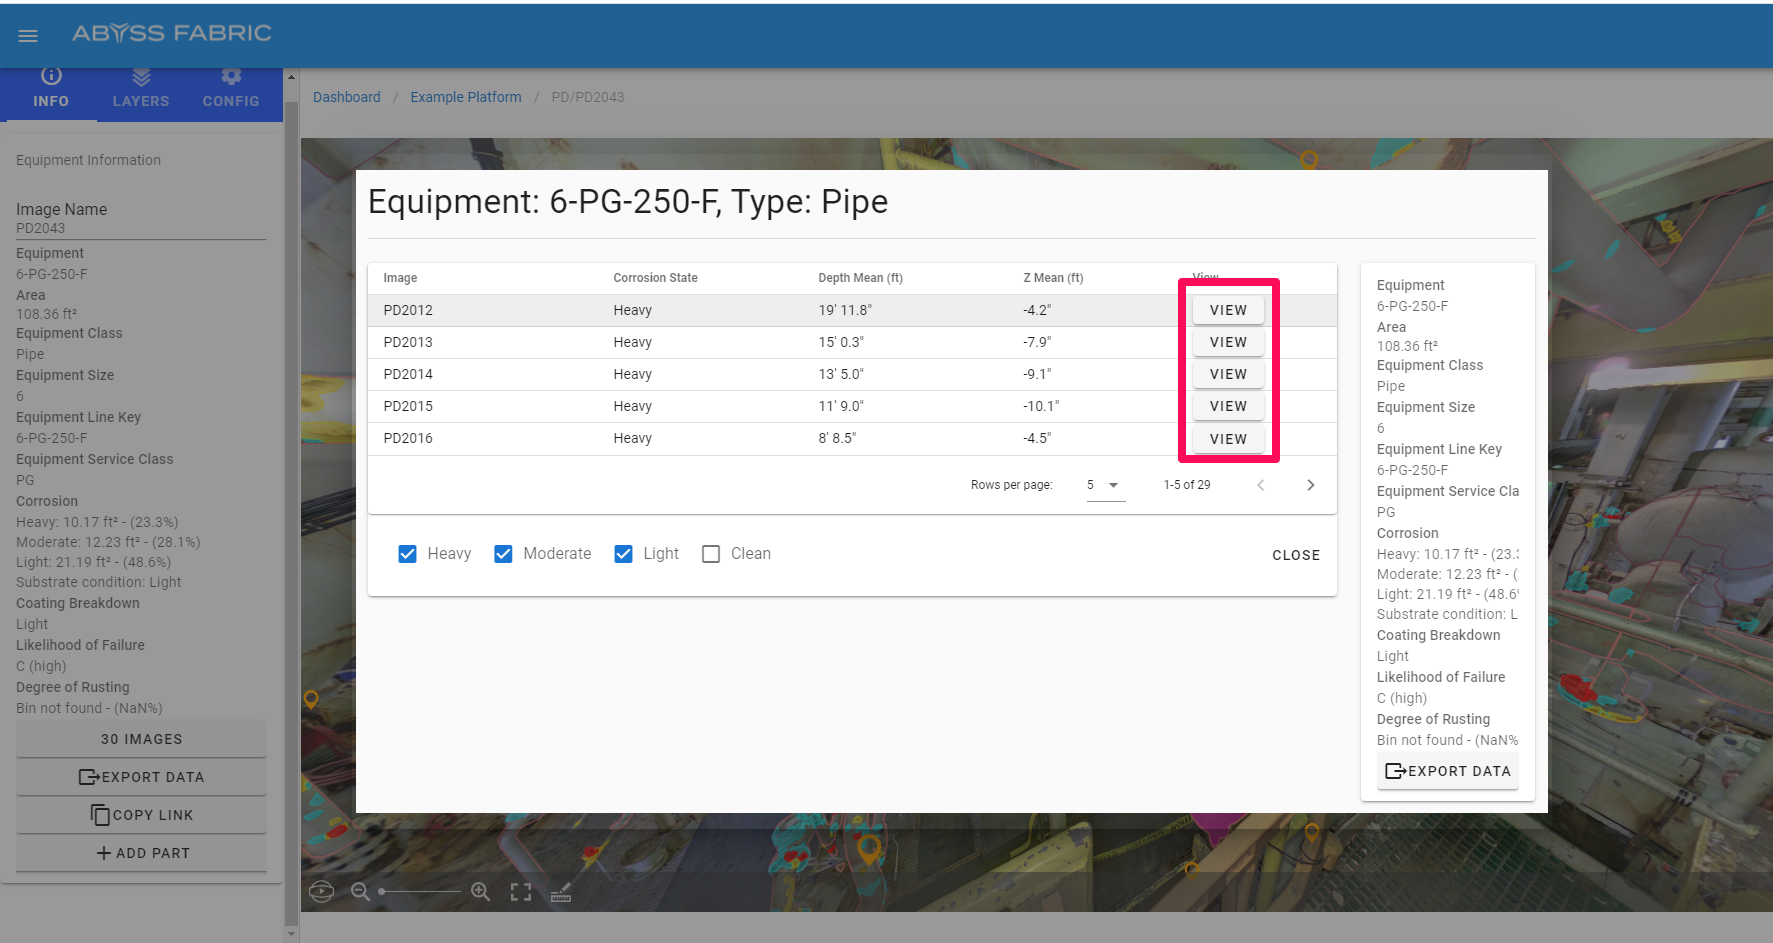
You can click on the images link to open a modal to help you navigate to different spherical images where the selected part can be viewed.

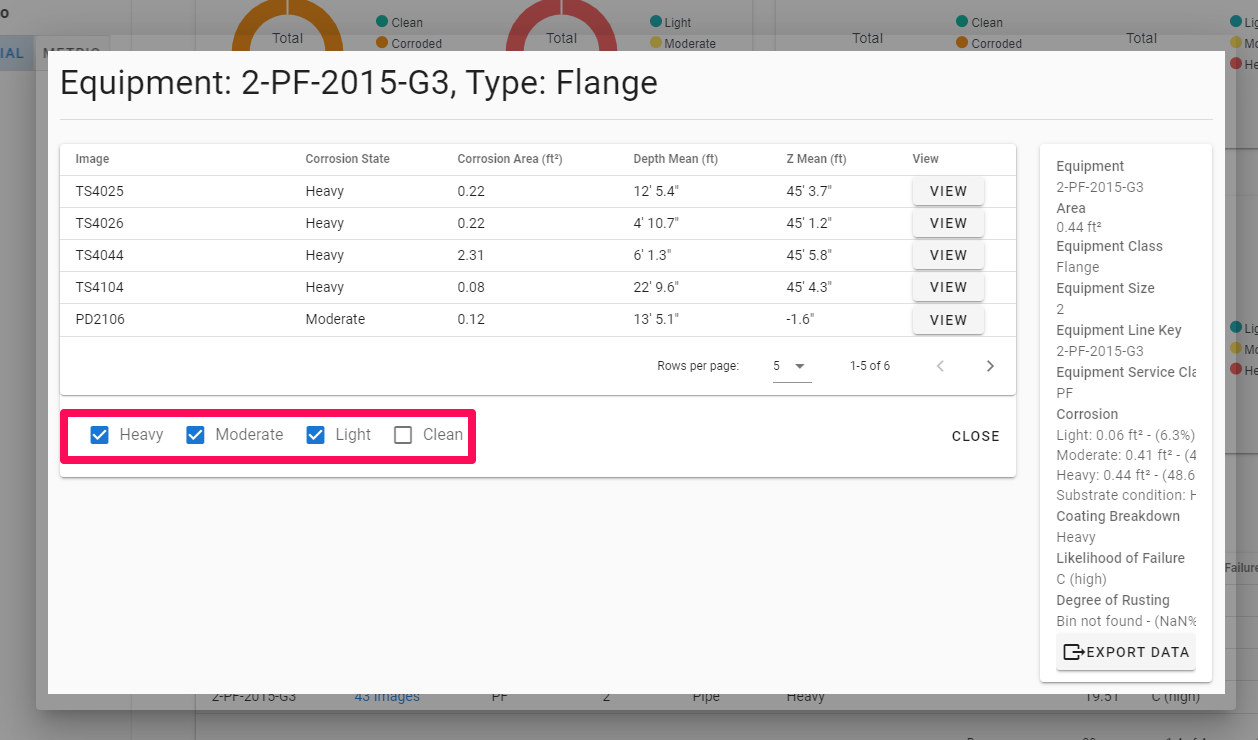
Which will take you to a screen with details on the corrosion levels visible on each image.
The Depth Mean value represents the distance from the camera position the image has been taken from. By selecting the image with the lowest Depth Mean, you will be taken to the image closest to the part.
The Z Mean value represents the height of the part relative to the lowest point on the platform.
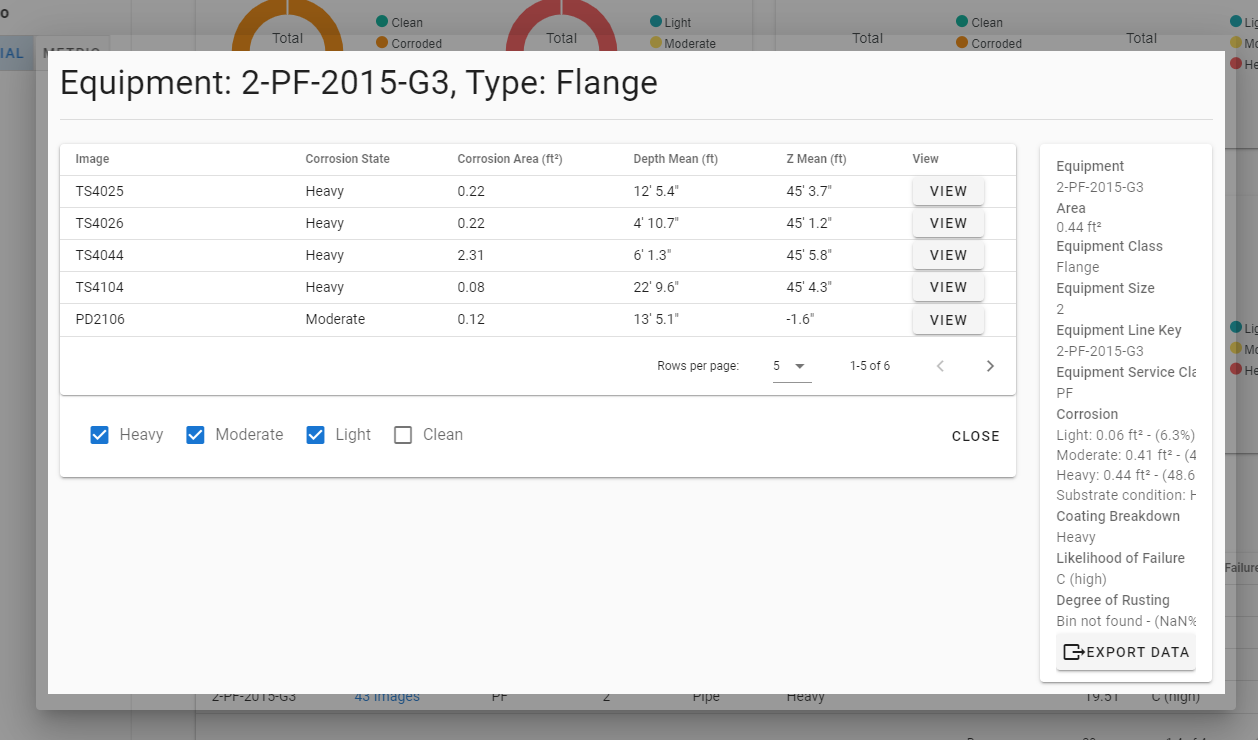
You can navigate to the spherical viewer with the part highlighted by clicking on the view button.
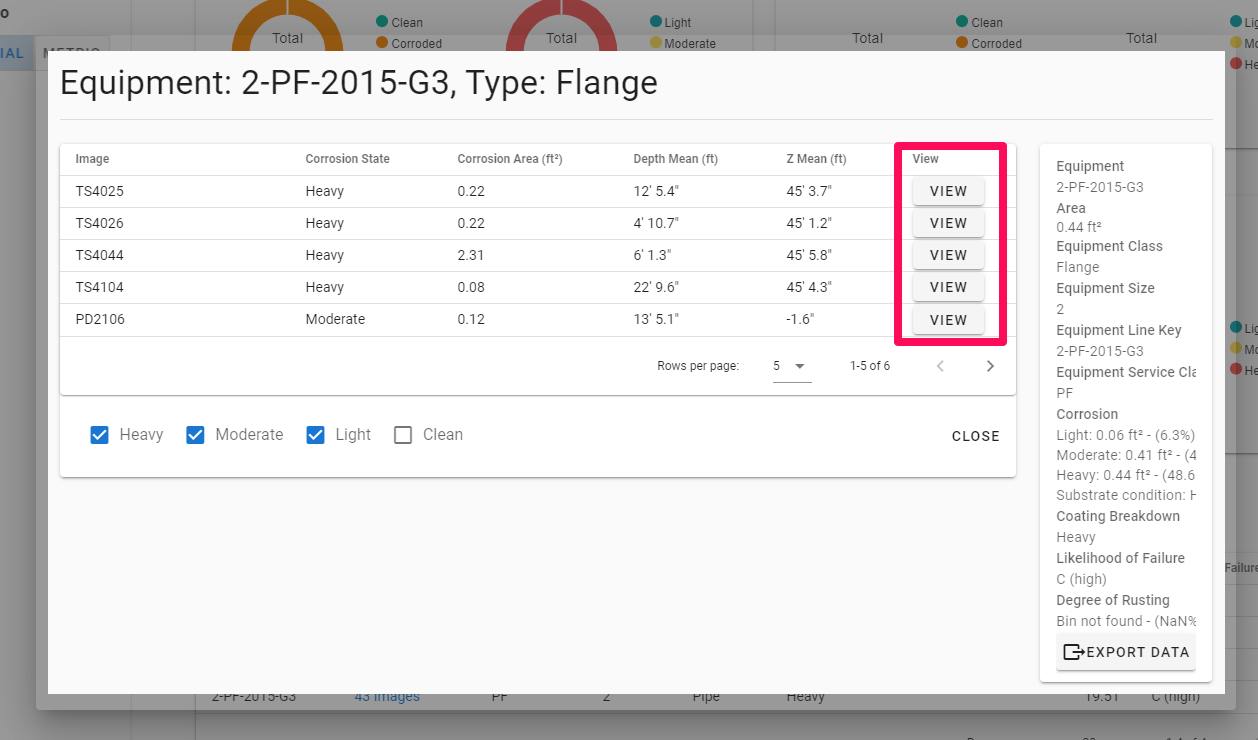
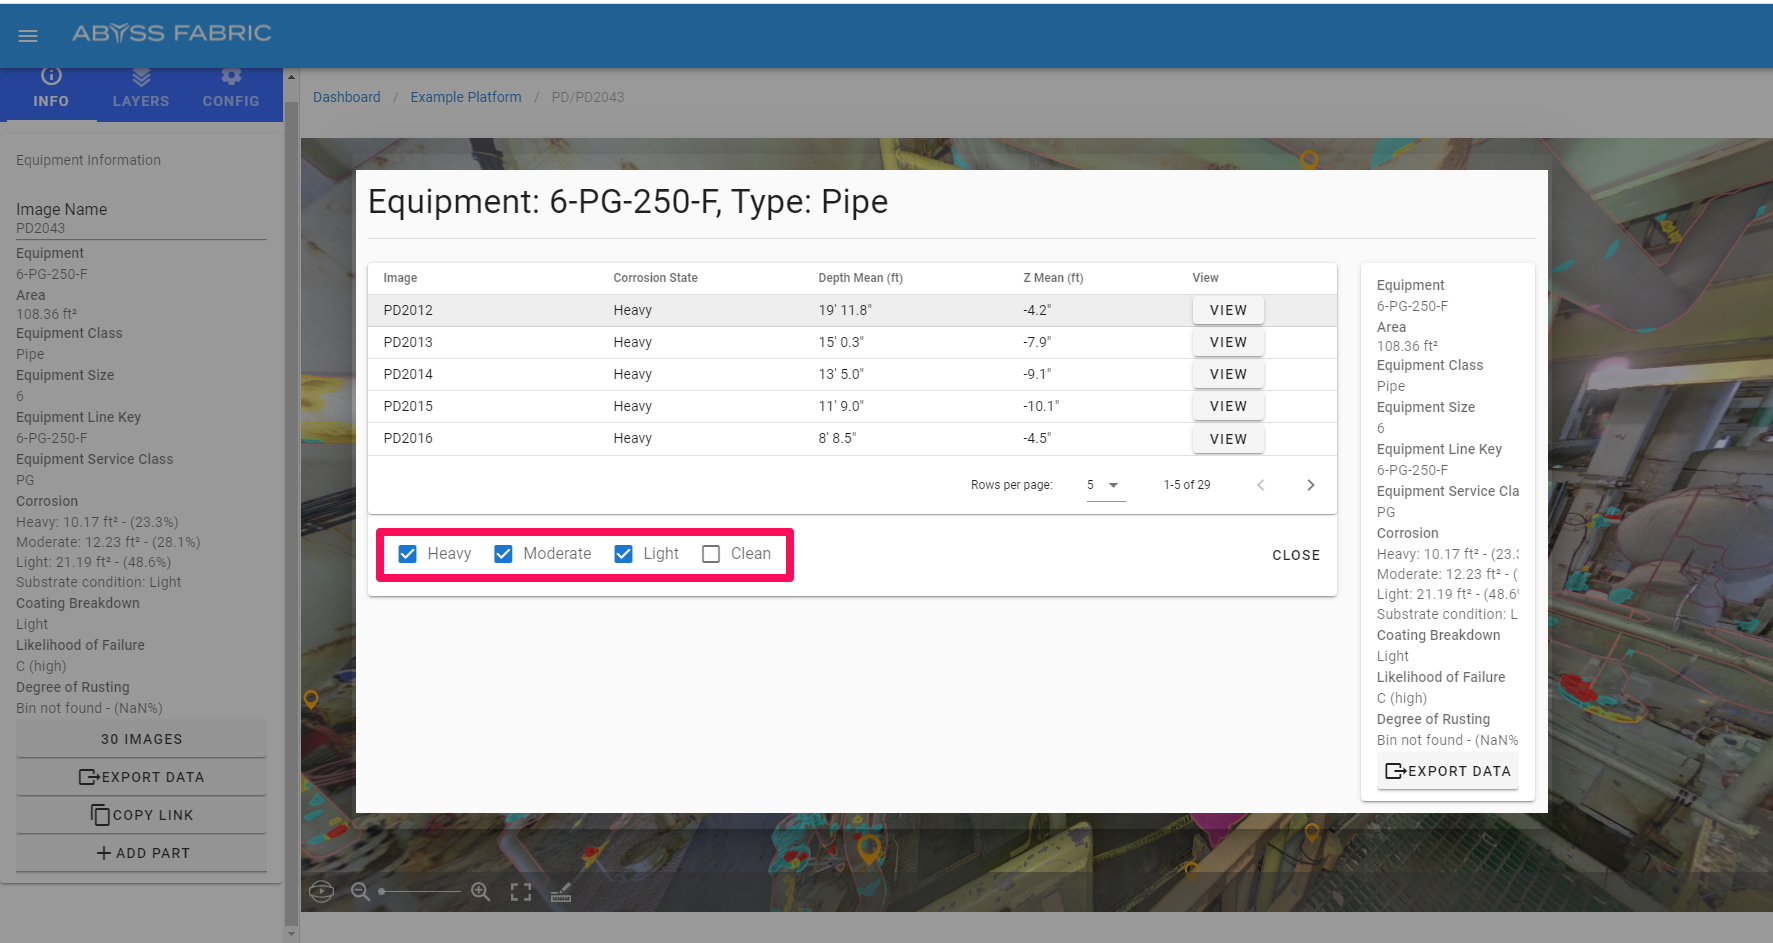
You can filter the images according to which corrosion state you’re interested in.
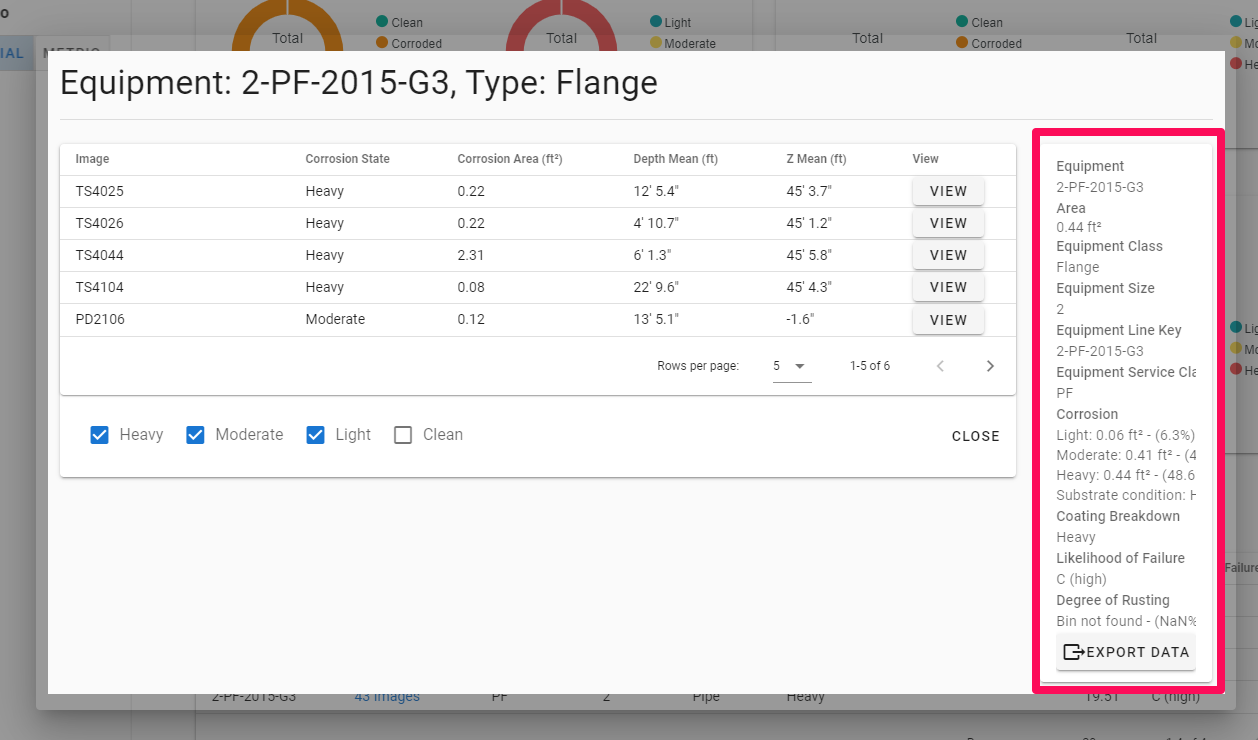
A quick insight into the part details can be viewed on the side panel of the modal.
Deck Plan
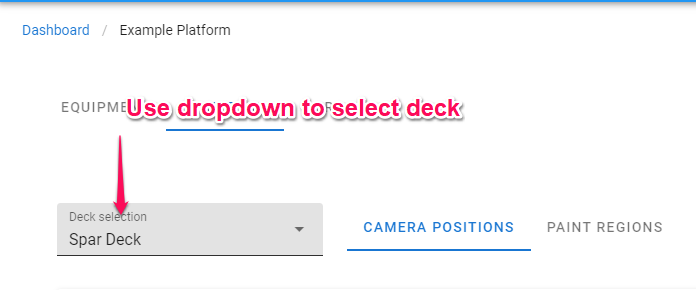
Deck Selector
You can select a deck using a dropdown. Changing the selected deck will limit the displayed diagram as well as the table by the selected deck.
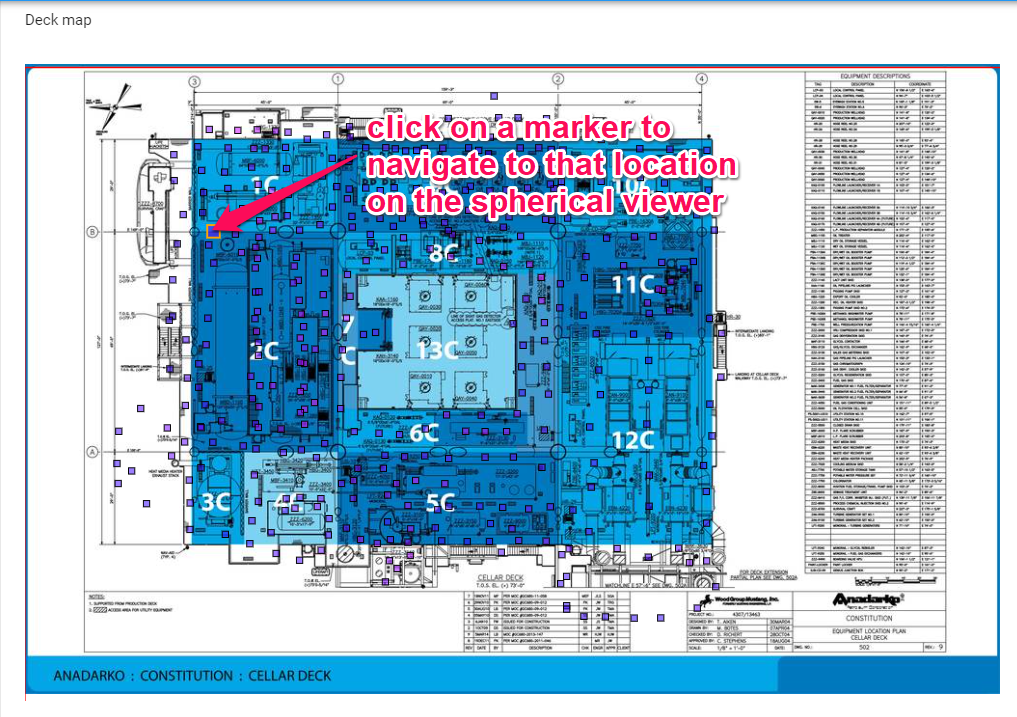
Deck Plan Diagram
The markers in the spherical viewer are color coded using the controls on the form next to the diagram.
Selecting a Location
From the deck plan you can select a location by clicking a marker on the plan.
Heat Map Coloring
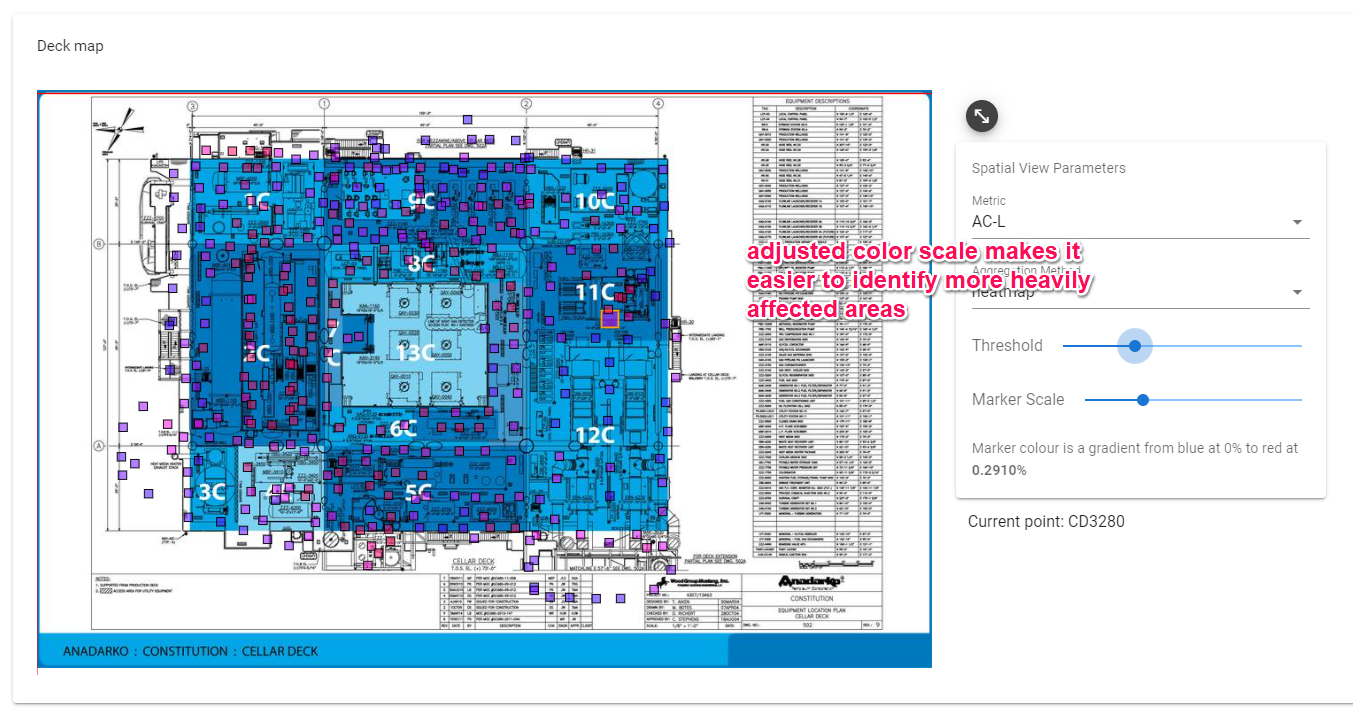
The locations on the deck plan are color coded. By default blue markers indicate there is no corrosion visible from the image, and red meaning fully corroded. The Controls panel allows you to customize the scale used to control the heat map coloring, making it easier to see part corrosion relative to other parts on the deck.
Controls
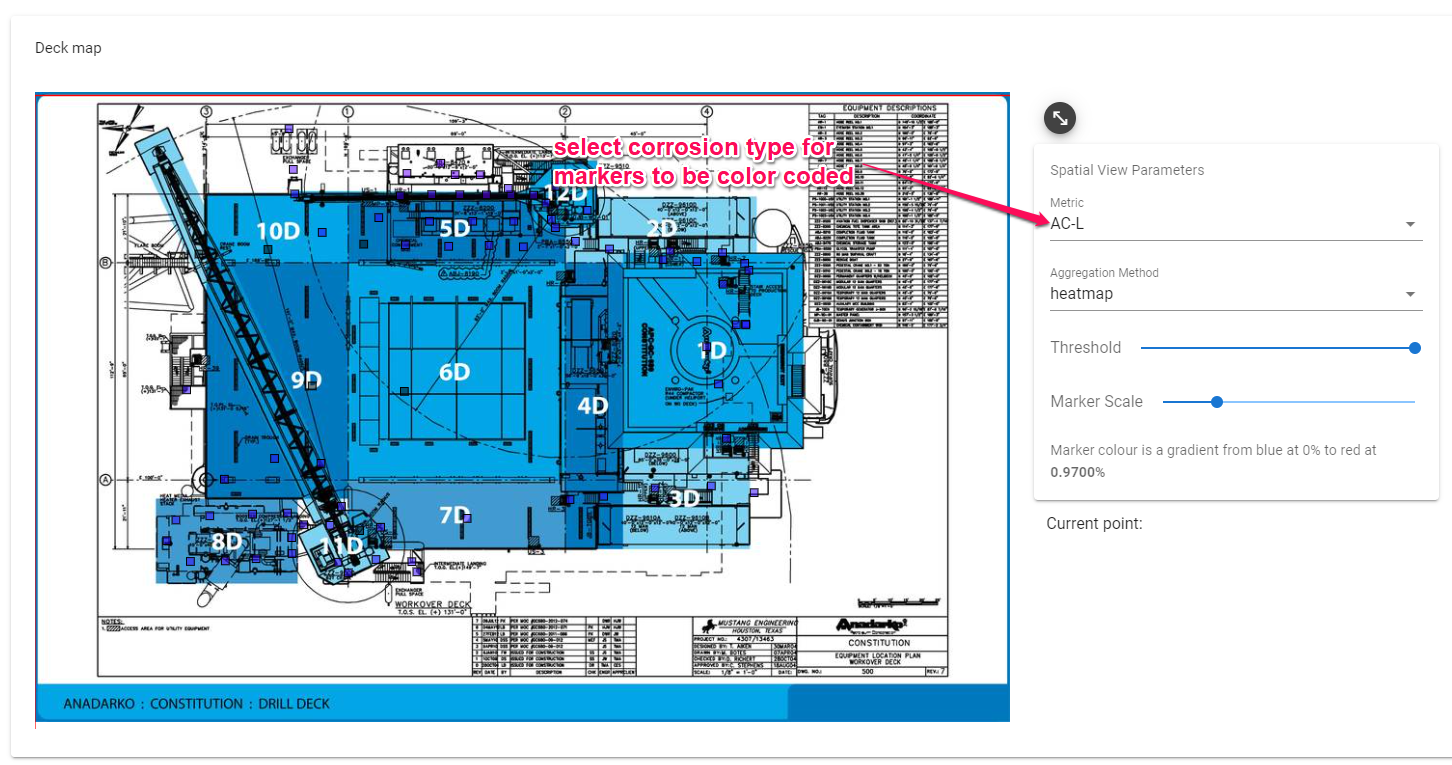
Targeted Metric
You can select the metric used to color code the markers using a dropdown.
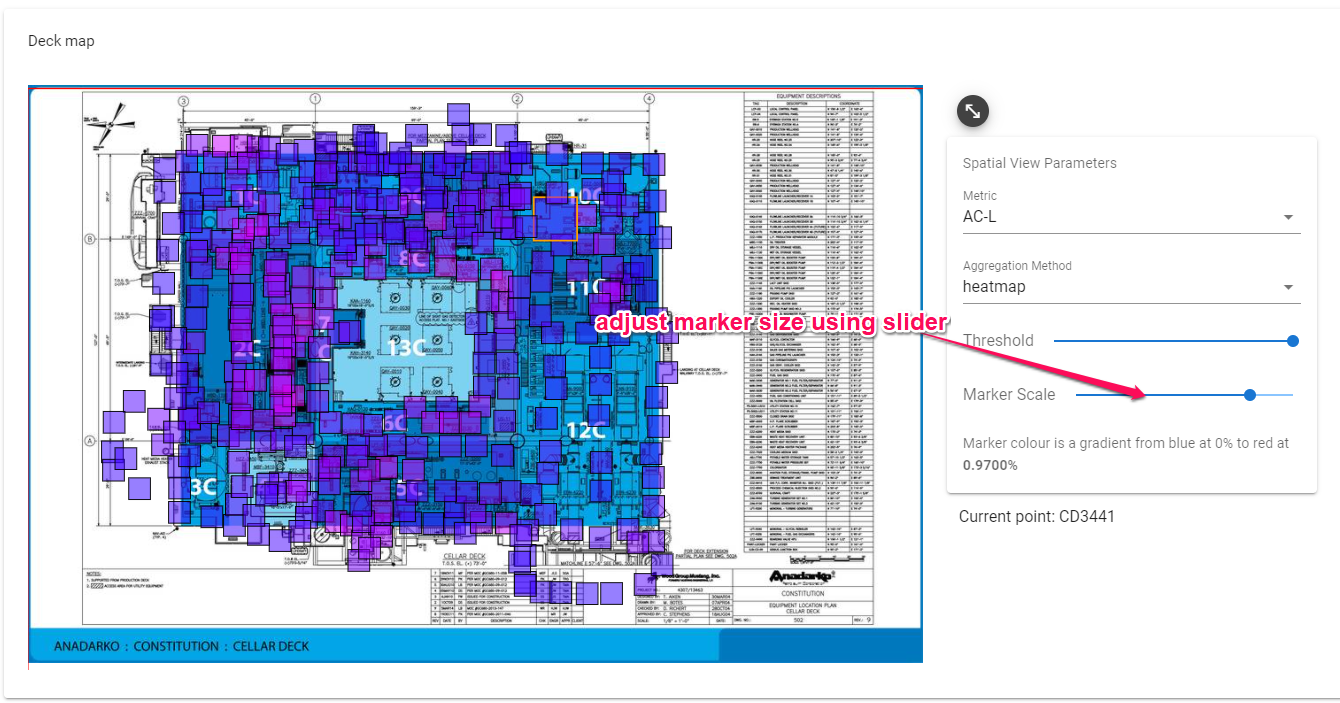
Marker size
You can control the size of the markers using a slider.
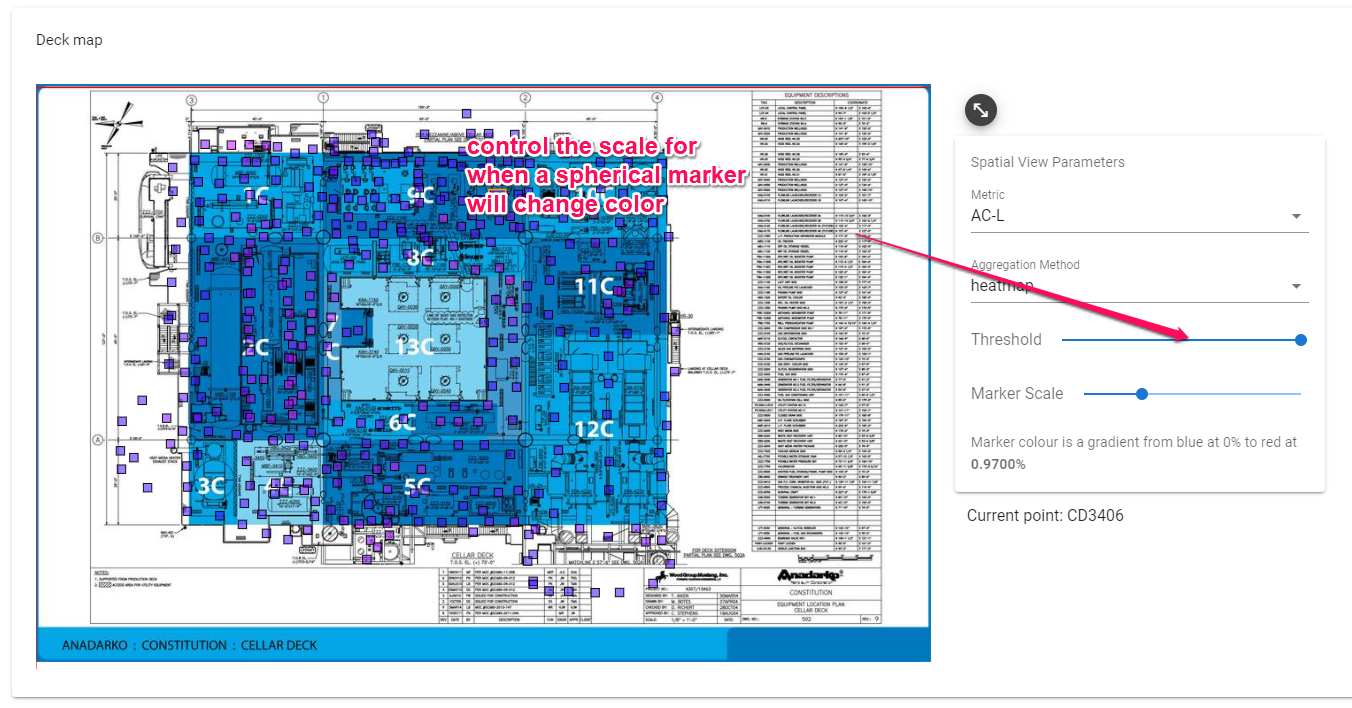
Color Threshold
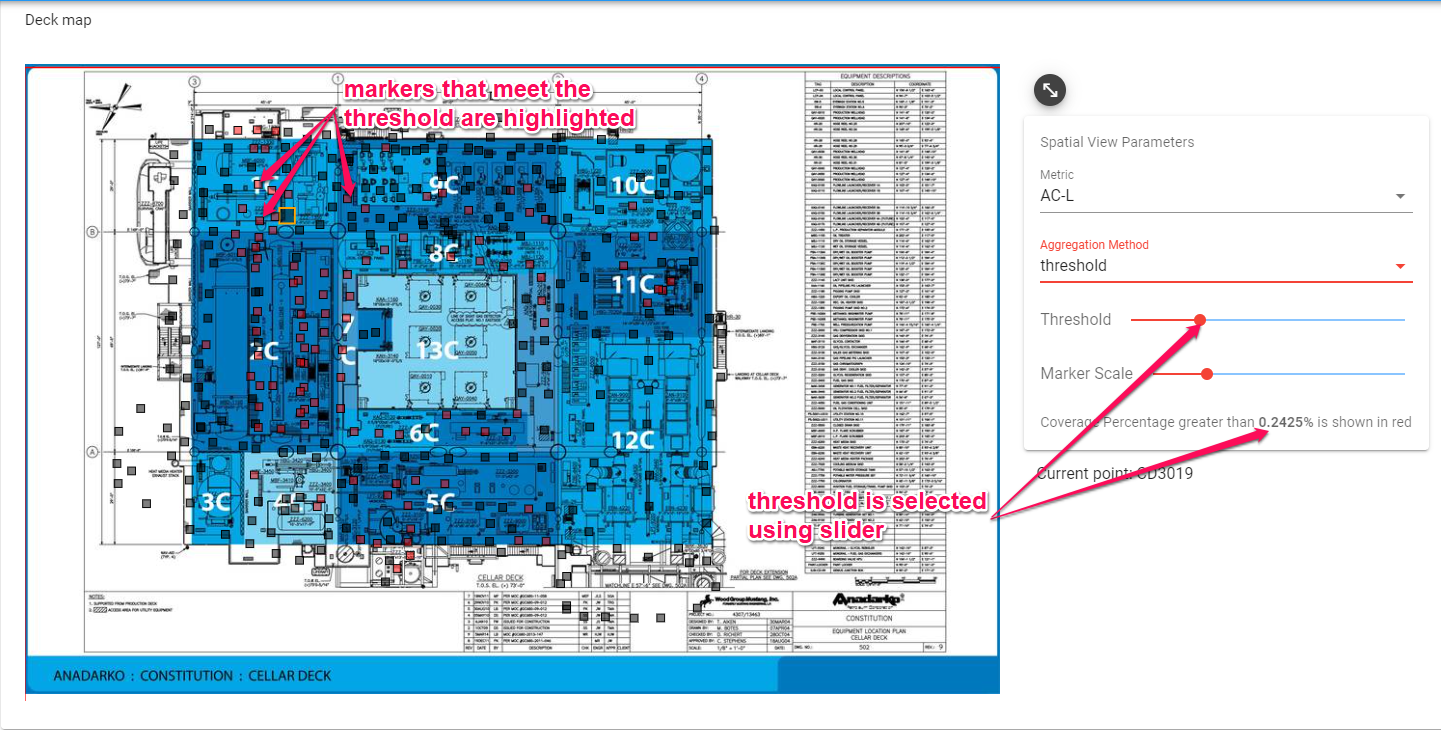
You can control the threshold for the coloring of the locations using a slider.
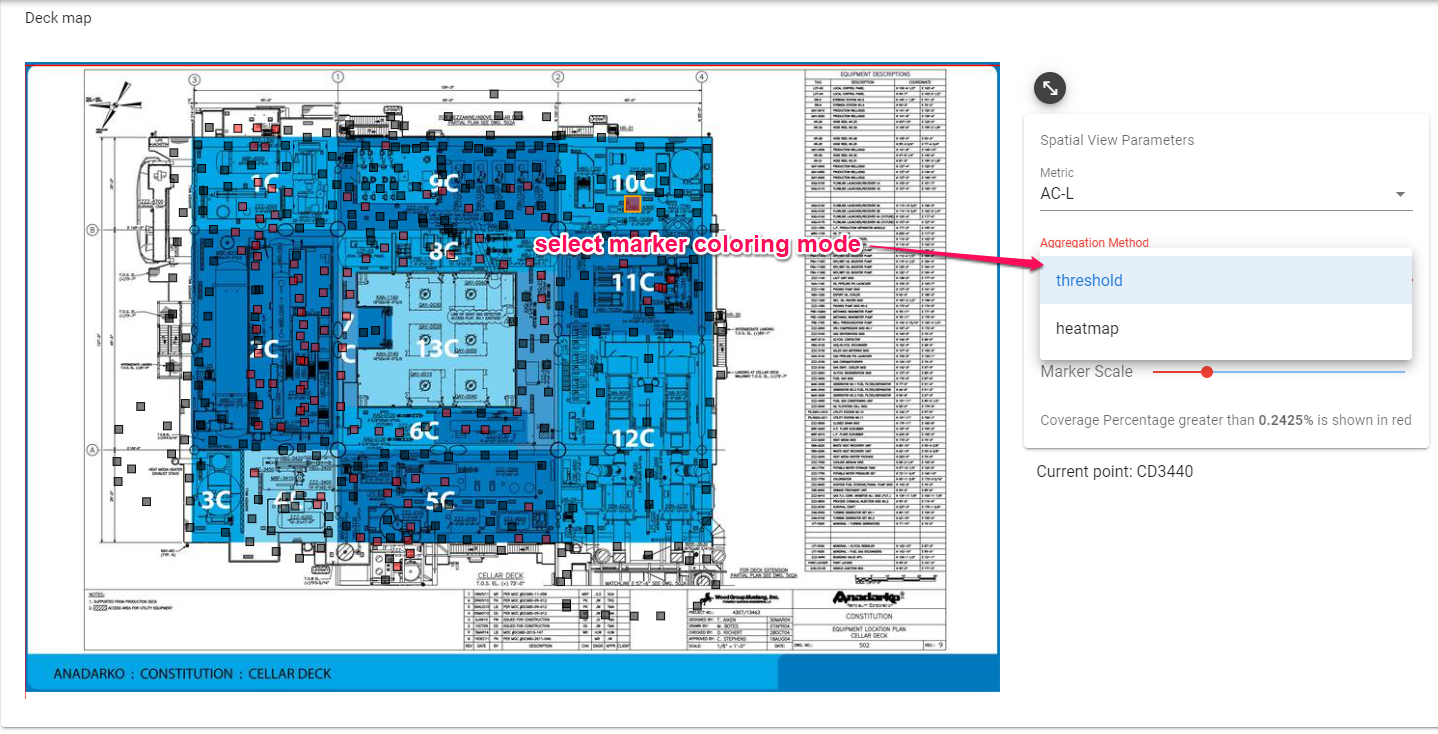
Marker coloring modes
To select the marker coloring mode use the Aggregation Method dropdown.
Threshold marker coloring
When using the threshold marker coloring mode, if spherical images meet the threshold then they will be highlighted in red.
Heatmap marker coloring
When using the heatmap marker coloring mode, when you adjust the threshold it changes the scale in which markers are colored, making it easier to see more heavily effected areas.
Highlighting
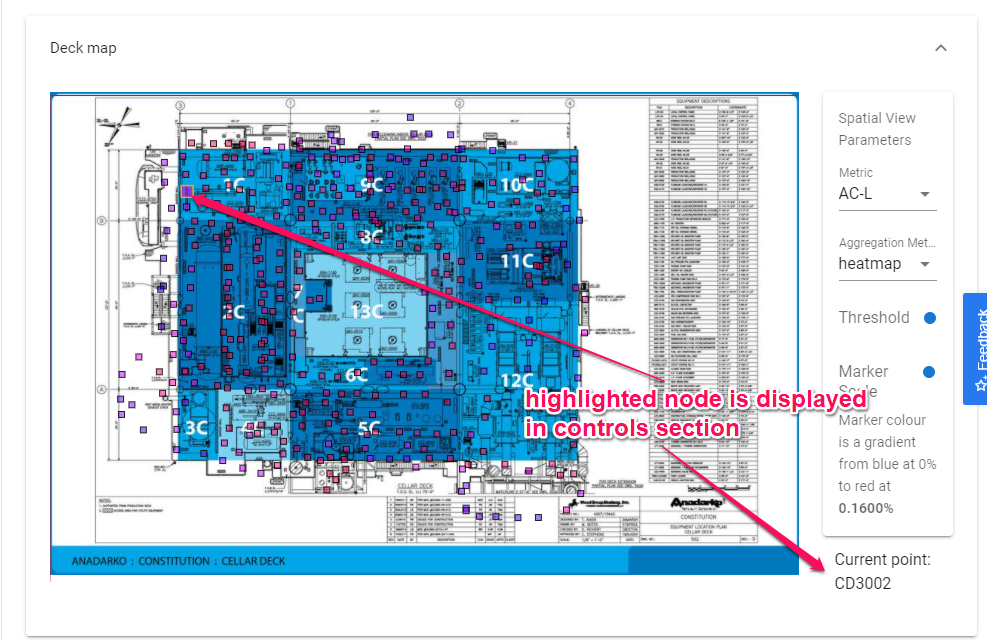
Hovering on a spherical will highlight it and the selected position will be displayed in the controls section.
Locations table
Selecting a Location
You can select a location by clicking on the link on the table row.

Sorting
You can sort by different metrics by clicking on the table headers.

Highlighting
When you hover on a row in the table, the diagram will have an updated marker showing the highlighted area.
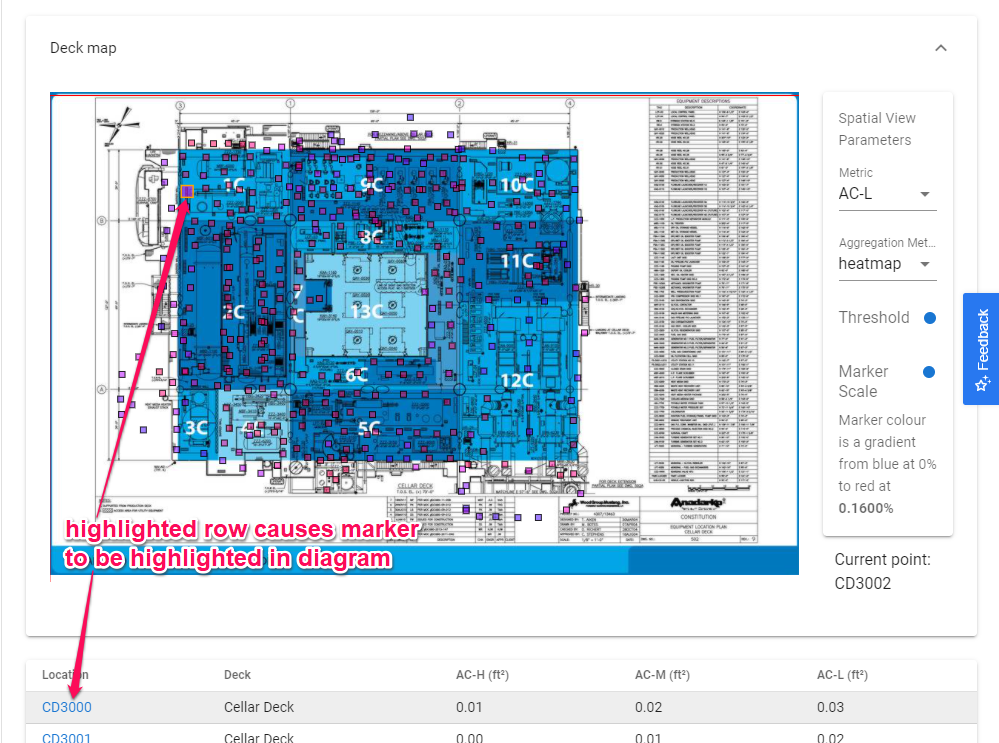
While using all decks from the deck selector, when you highlight a row, the deck viewer diagram will update to show the correct deck.
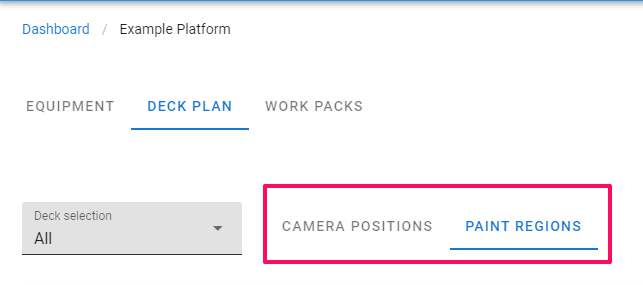
Paint Regions
Click on the Paint regions tab to view the paint regions on the platform.
Paint regions are shown as an overlay on the deck diagrams.
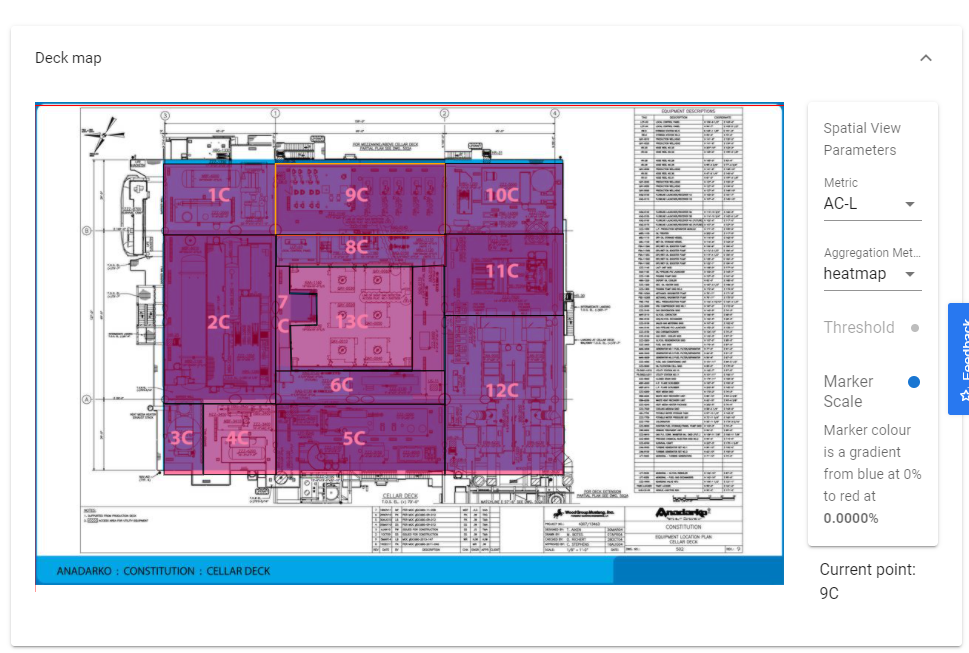
Spherical View
Navigation
Spherical markers
When you are in the spherical viewer, there are pins that mark the location of other spherical locations.
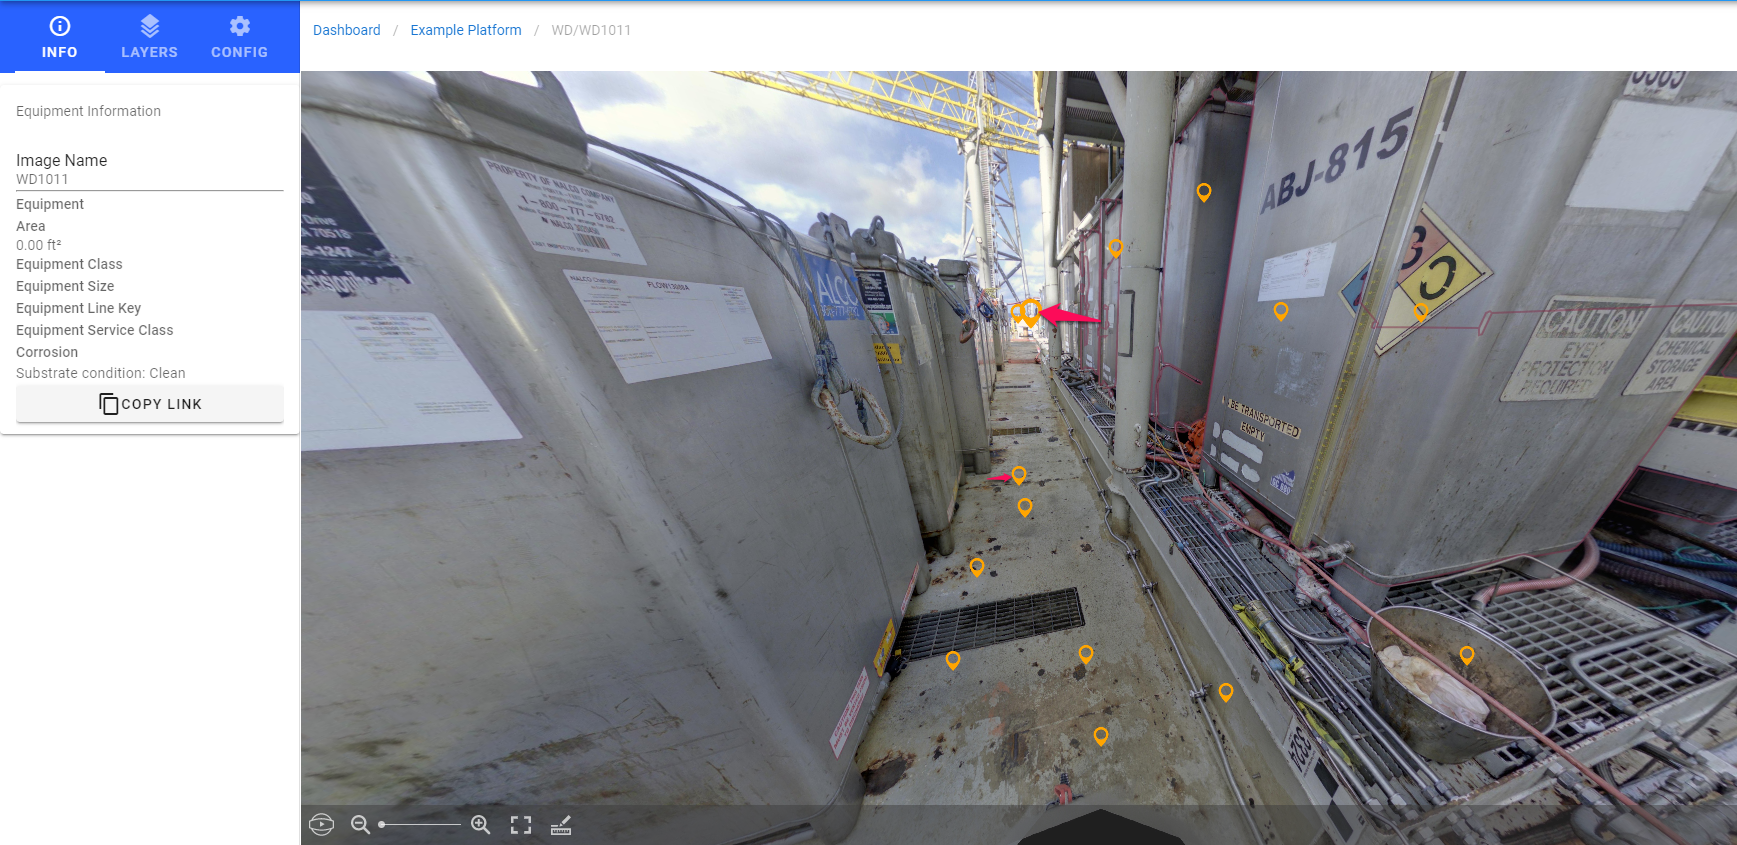
Smaller pins are further away and larger pins are closer to your current location.
To navigate to a new location click on one of the pins.
Other views of selected equipment
You can navigate to alternate views of a selected part by selecting a different image that the part is visible in by clicking on the images button and selecting an image.
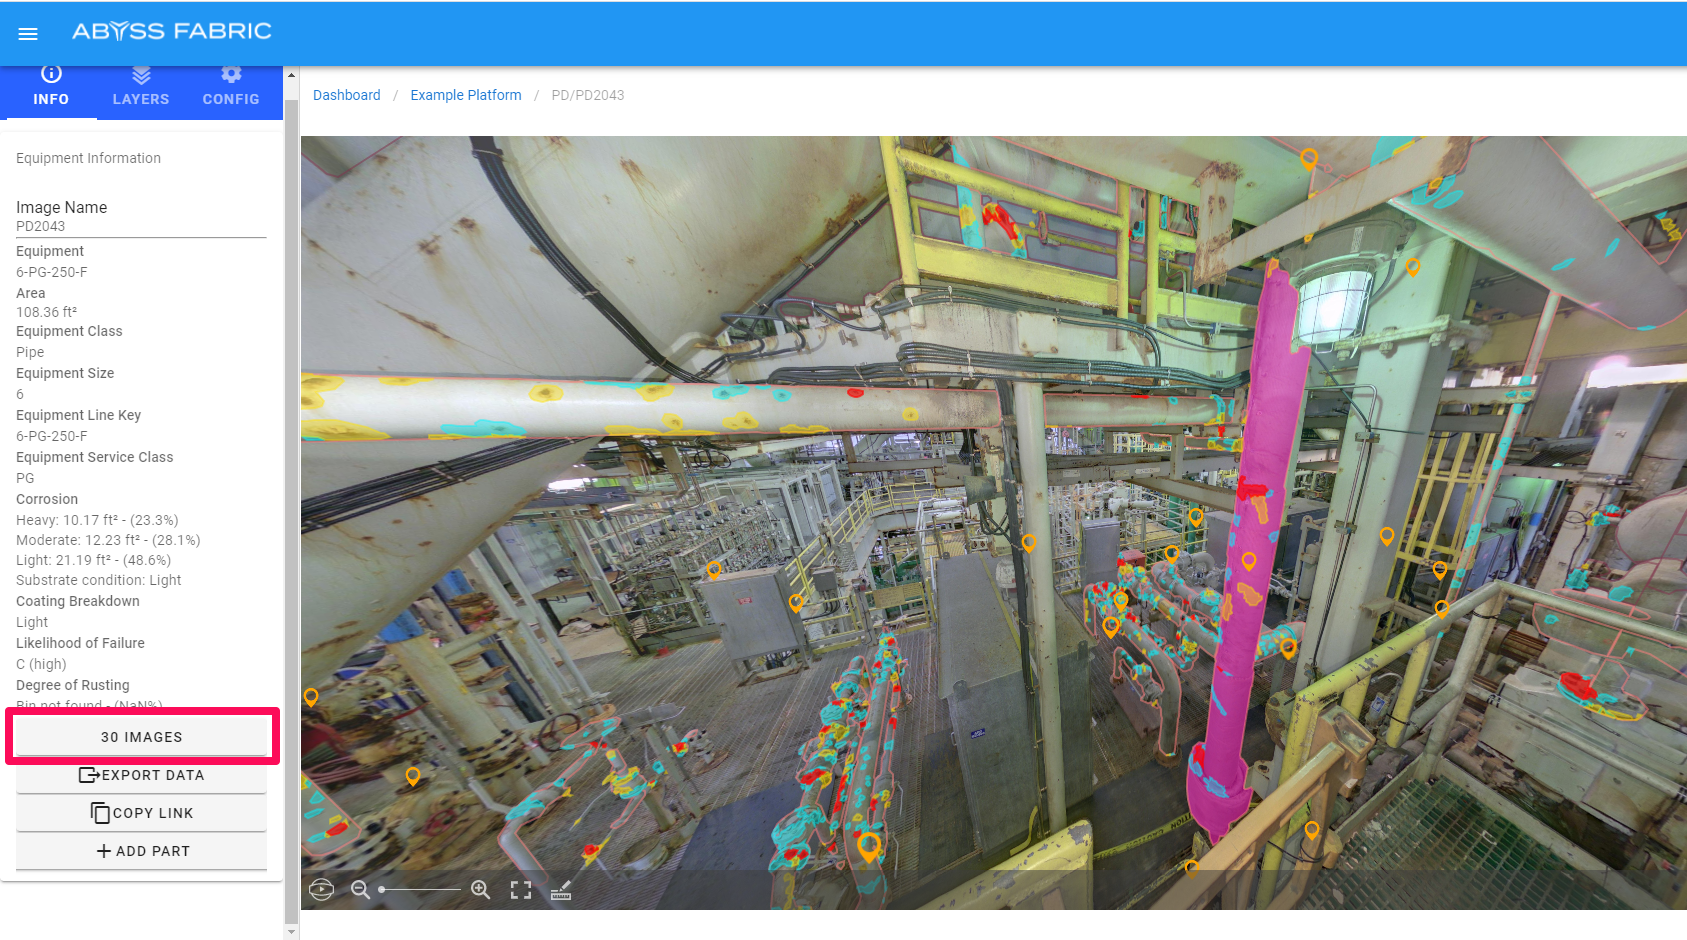
You can target specific levels of corrosion using the filters at the bottom.
Corrosion
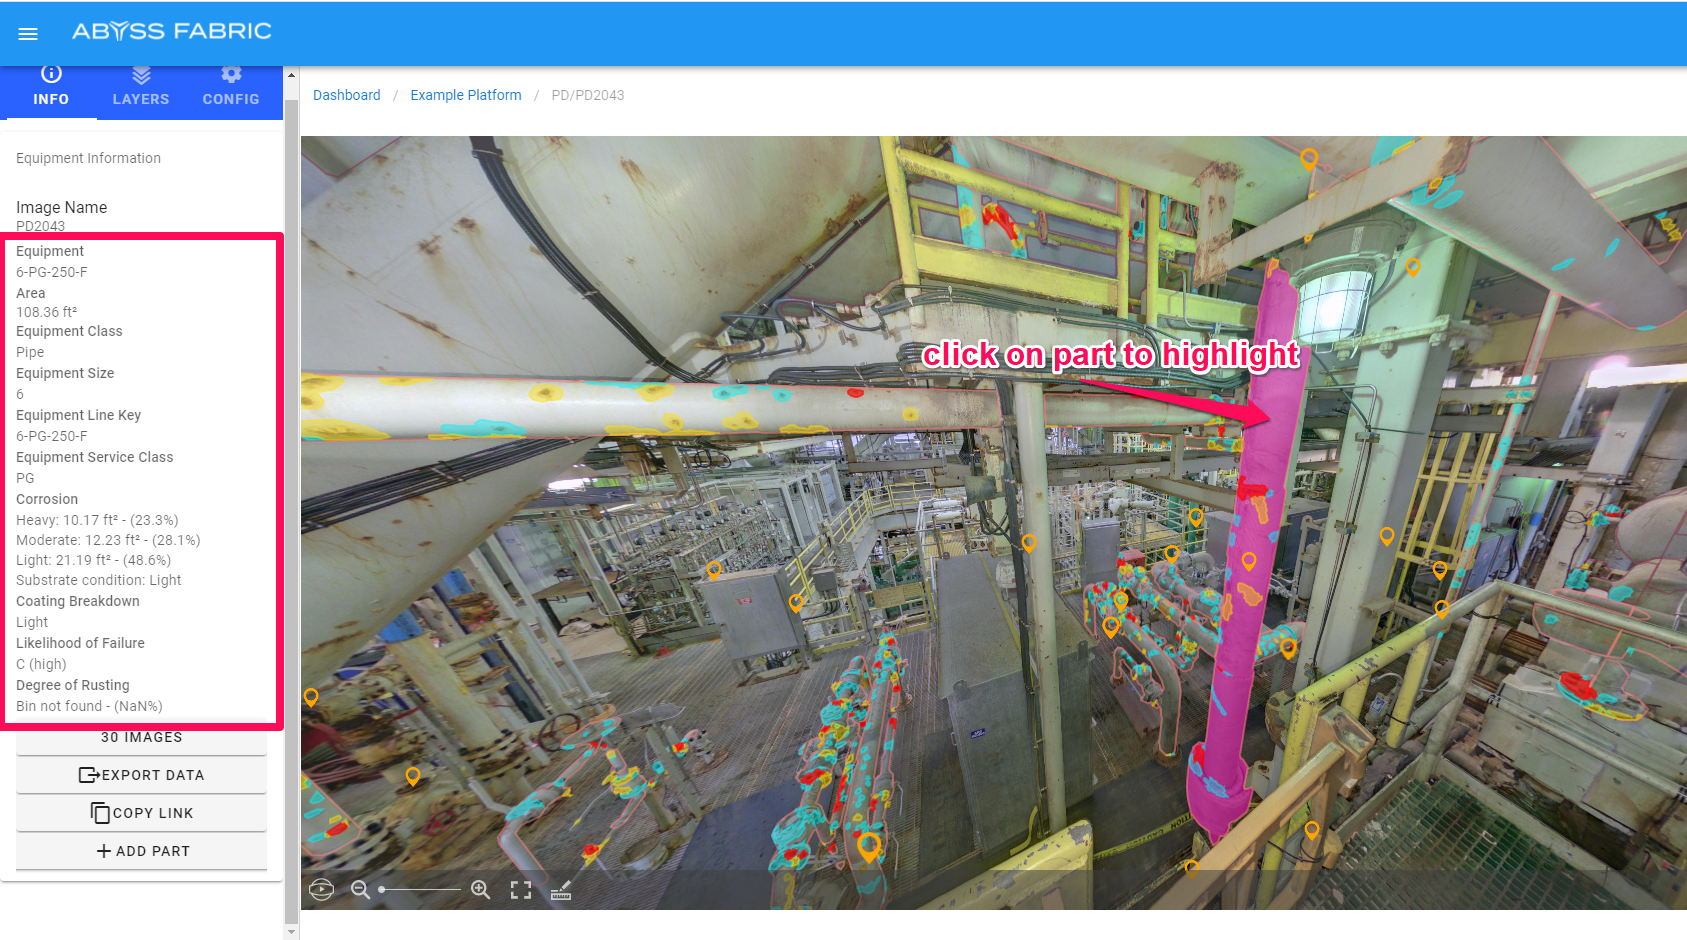
To control the display of corrosion while in the spherical viewer, you can turn the layers on/off through the layers tab. Corrosion is classified as Light, Moderate and Heavy based on the client standard and framework agreed upon with Abyss.
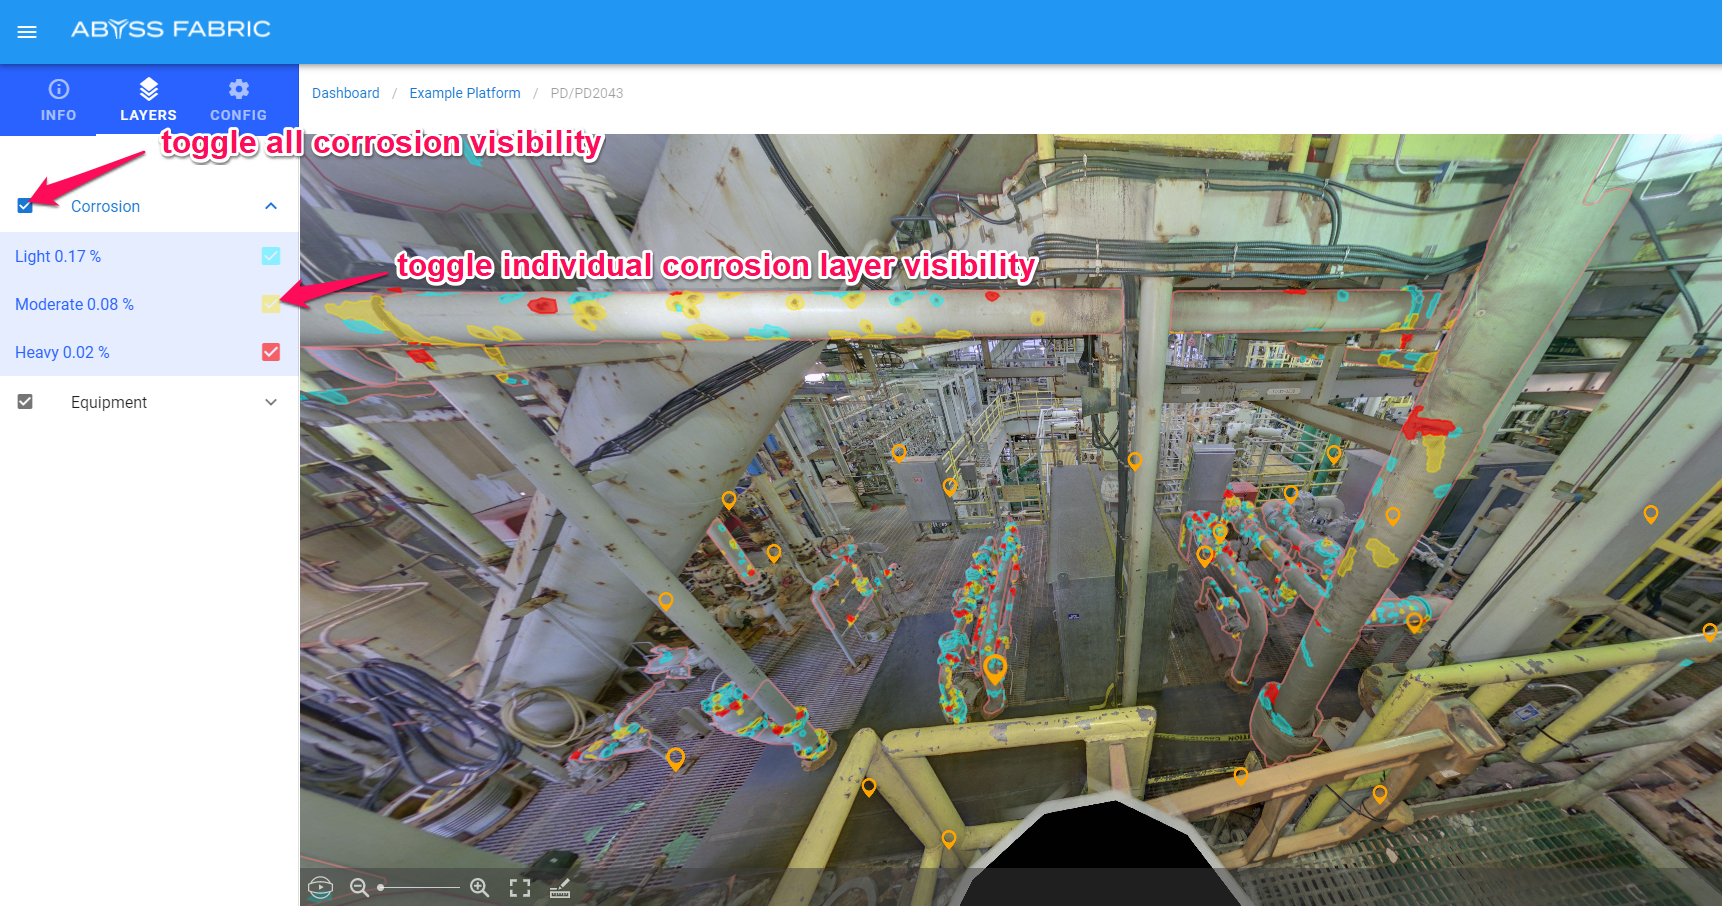
When corrosion is enabled, different severities of corrosion will be visible by color coded masks on the image.
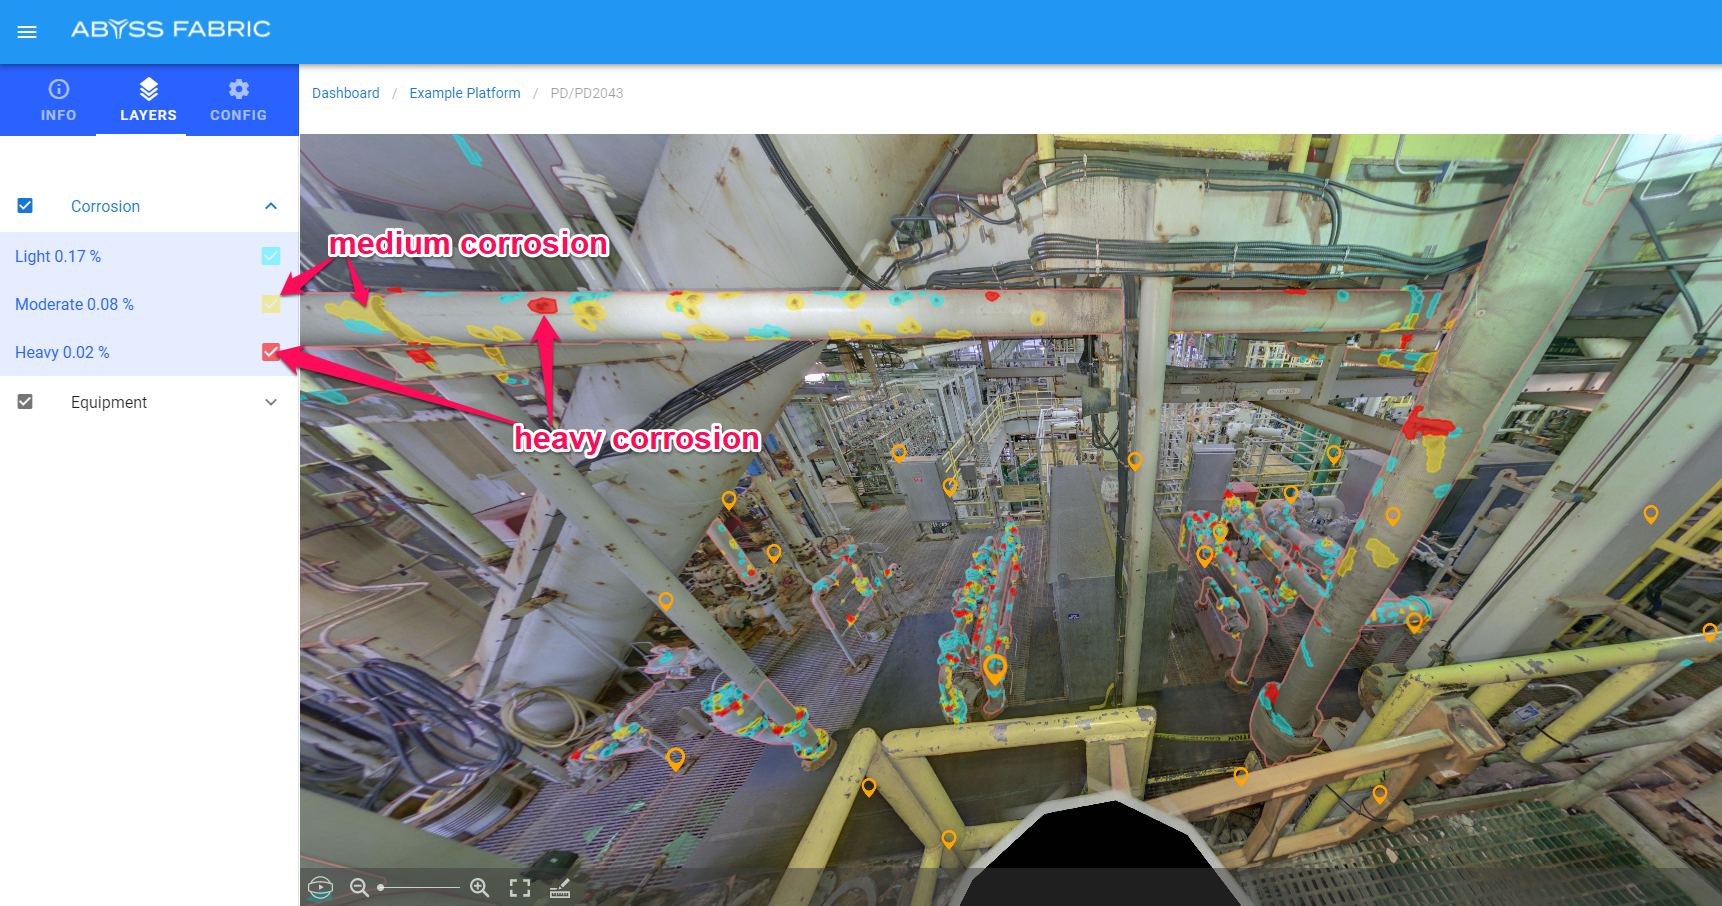
You can view more detailed information about the corrosion on a part by clicking on it. The part will be highlighted and corrosion information will be available on the part, even if that portion of corrosion is not visible on the current image.
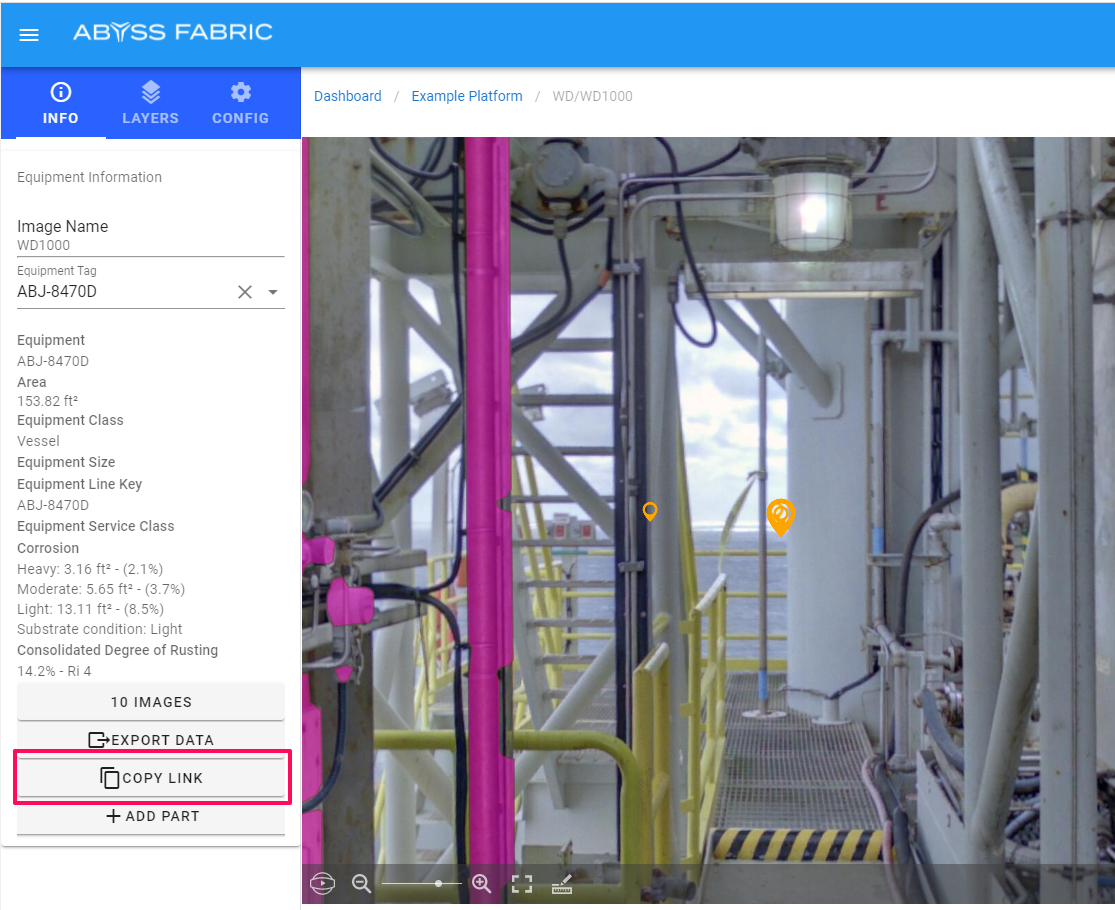
Copy Link
When you use the Copy Link button you can share the current view of the spherical, including your viewing angle, zoom and selected equipment.
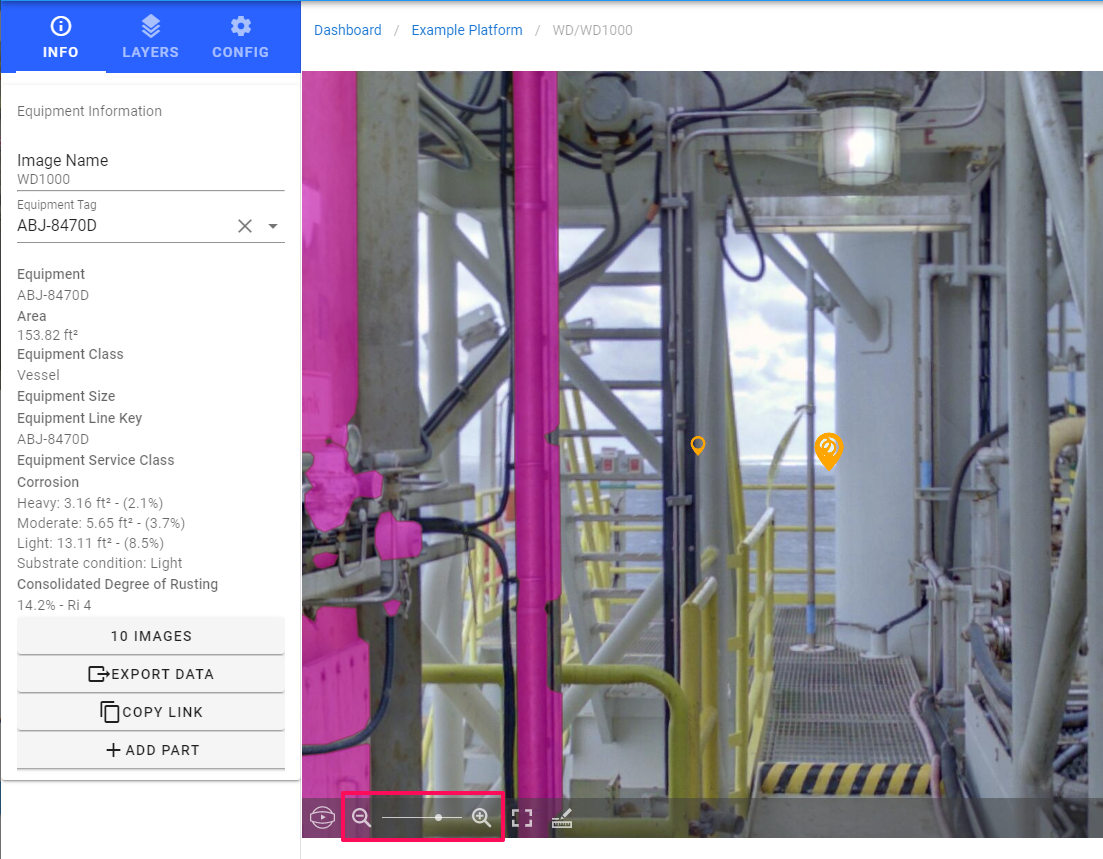
Zoom
To control the image zoom, use the zoom tool in the toolbar.
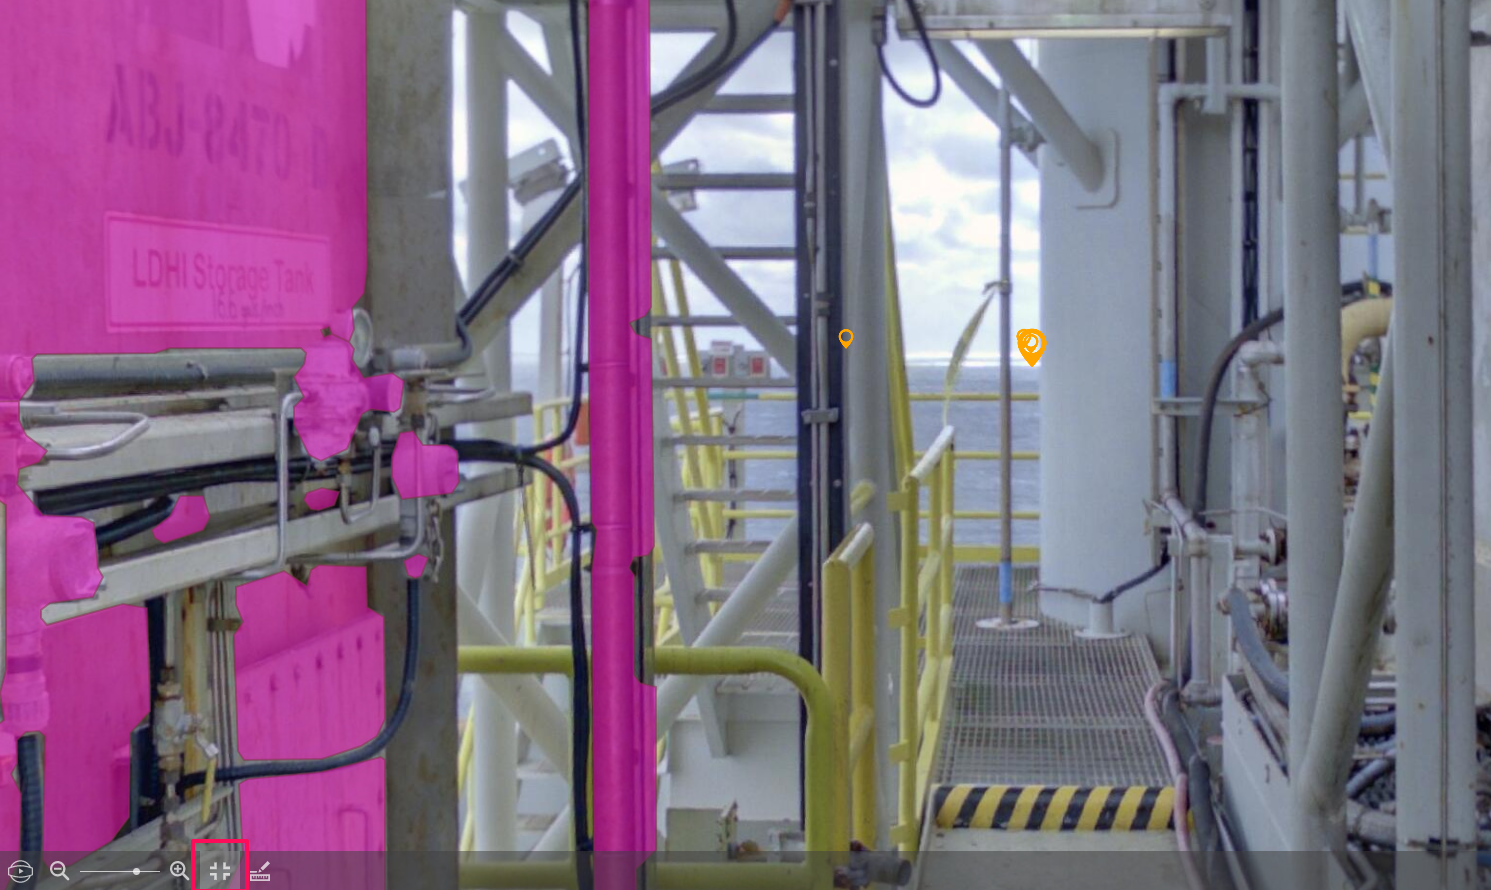
Full screen view
To enter a full screen view of the image, use the full screen expand button.
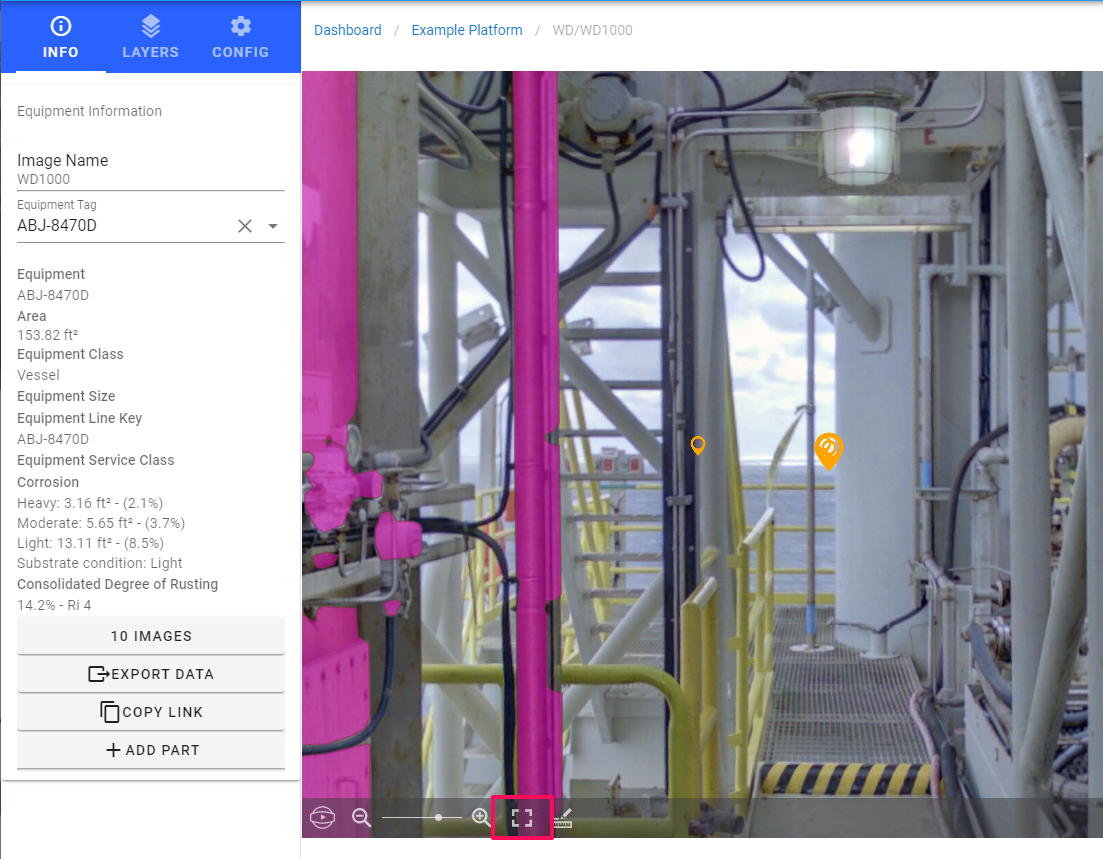
To exit full screen mode you can either hit the escape key on your keyboard or click the collapse full screen icon which replaces the expand icon.
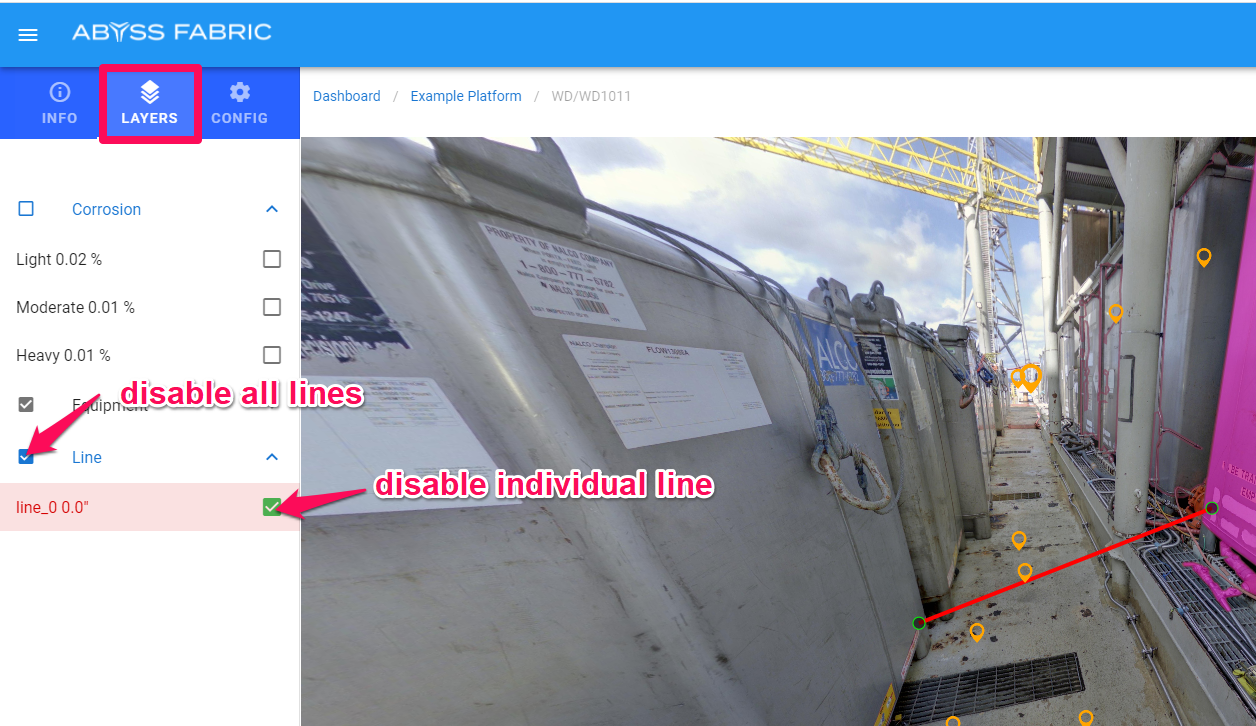
Measure Line
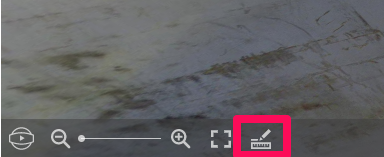
Measure the straight line distance between two points on the platform in physical distances (feet or metres)
First activate the Measure Line tool by clicking the icon in the spherical toolbar at the bottom of the image.
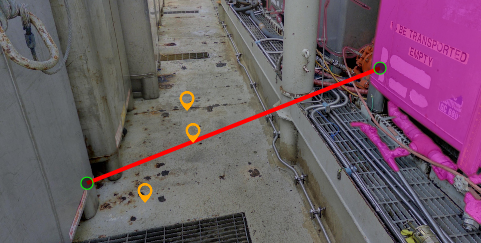
When in line mode you can click on the spherical image to create a points, after you have created two points a line will be generated with the distance of the line.
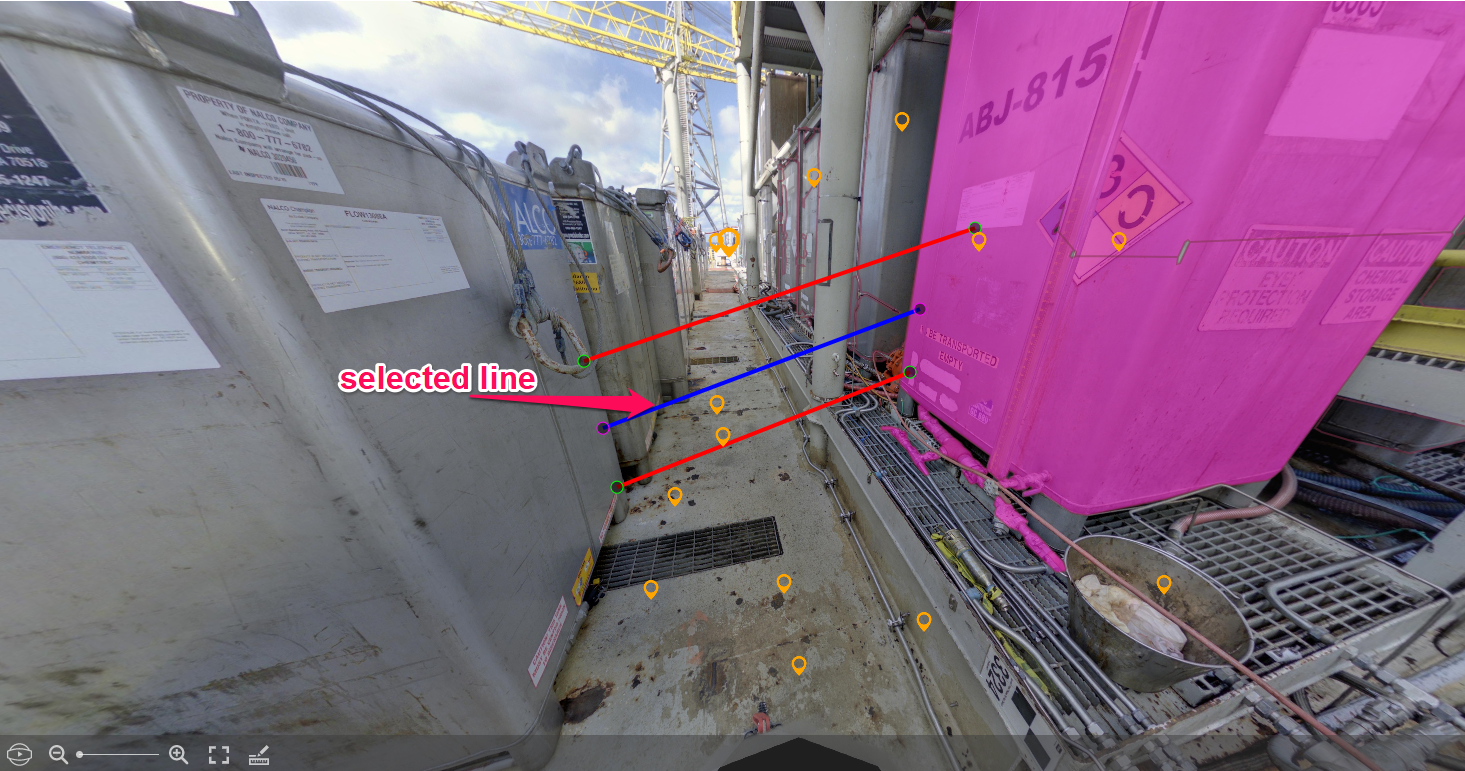
Once a line is created you can click on the line to select it, and press the DELETE button to delete the line.
You can toggle the visibility of Lines using the Layers tab.
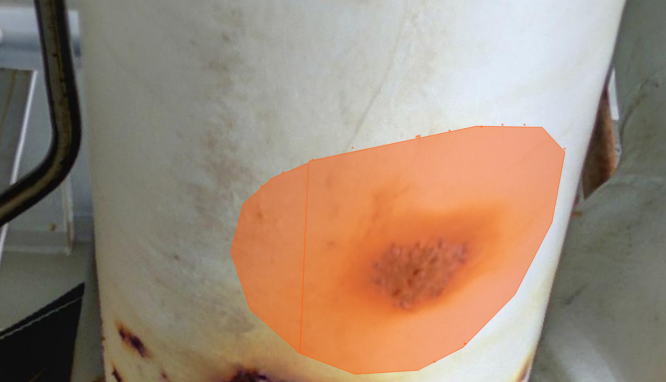
Measure Blister Height
Measure height of blisters and the depth of pits on flat or curved surfaces on the platform.
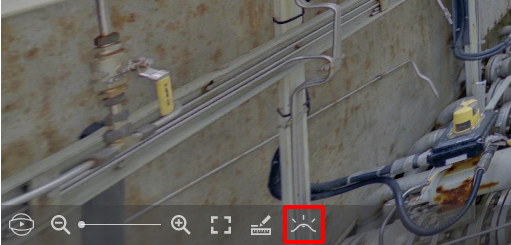
Activate the Measure Blister Height tool by clicking the icon in the spherical toolbar at the bottom of the image.
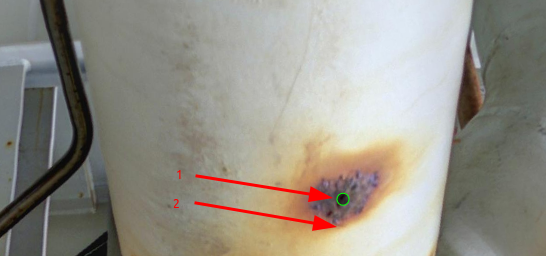
Two points must be selected:
The first click point sets the middle of the blister measurement circle
The second click point sets the edge of the measurement area; a radius around the middle of the blister.
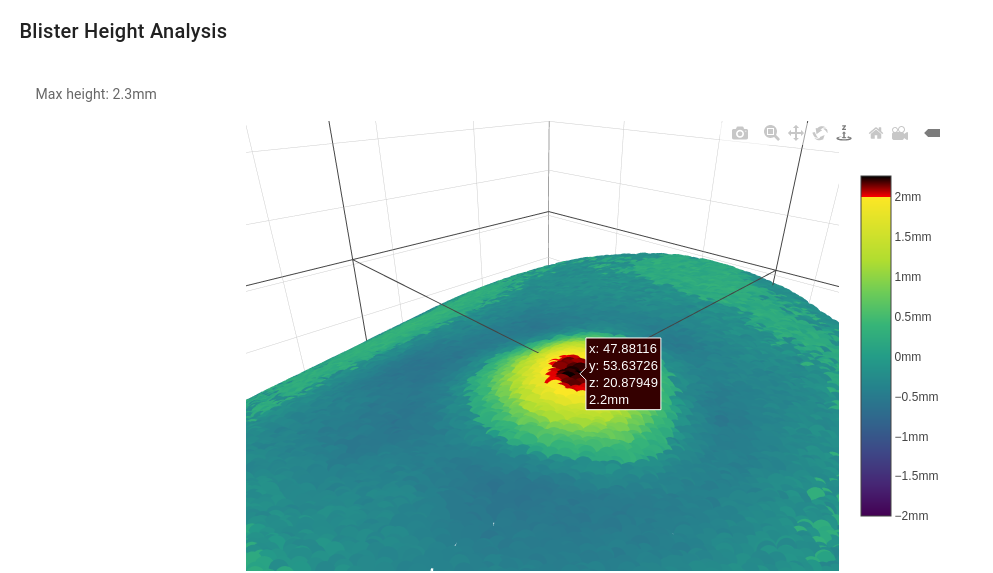
Abyss Fabric will conduct a blister height analysis and present an interactive 3D measurement of the blister. The blister can be rotated and zoomed in 3D, each point will have the height and depth from the surface calculated; the units will be either in inches or mm. Move the mouse over the 3D surface to show the height for each point.
Within the spherical view the analysis area is available on the image, and can be clicked to retrieve the 3D analysis tool without re-calculating the blister.
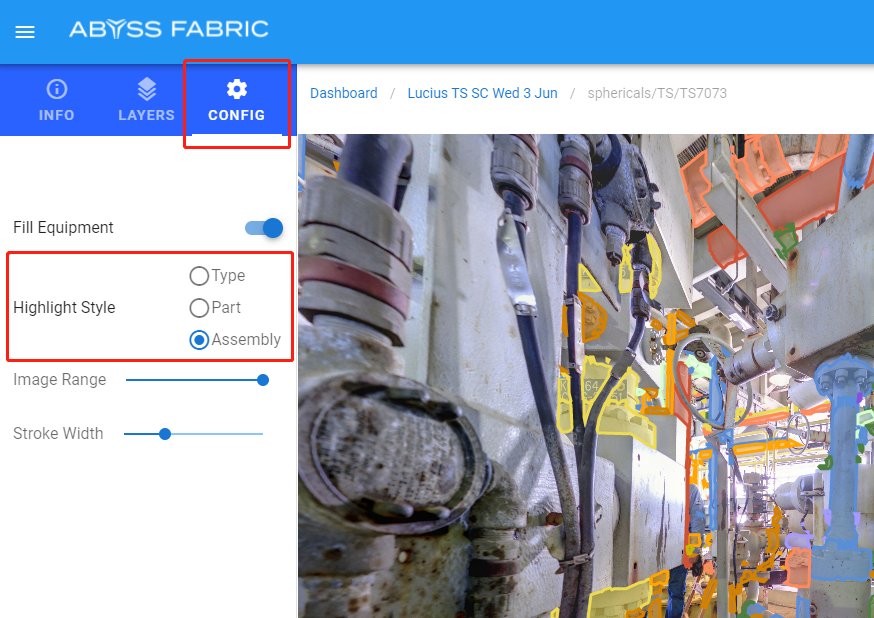
Highlight pattern
Spherical view provides different highlight style to help giving users a clearer view.
This can be changed in the Config tab in the spherical viewer.
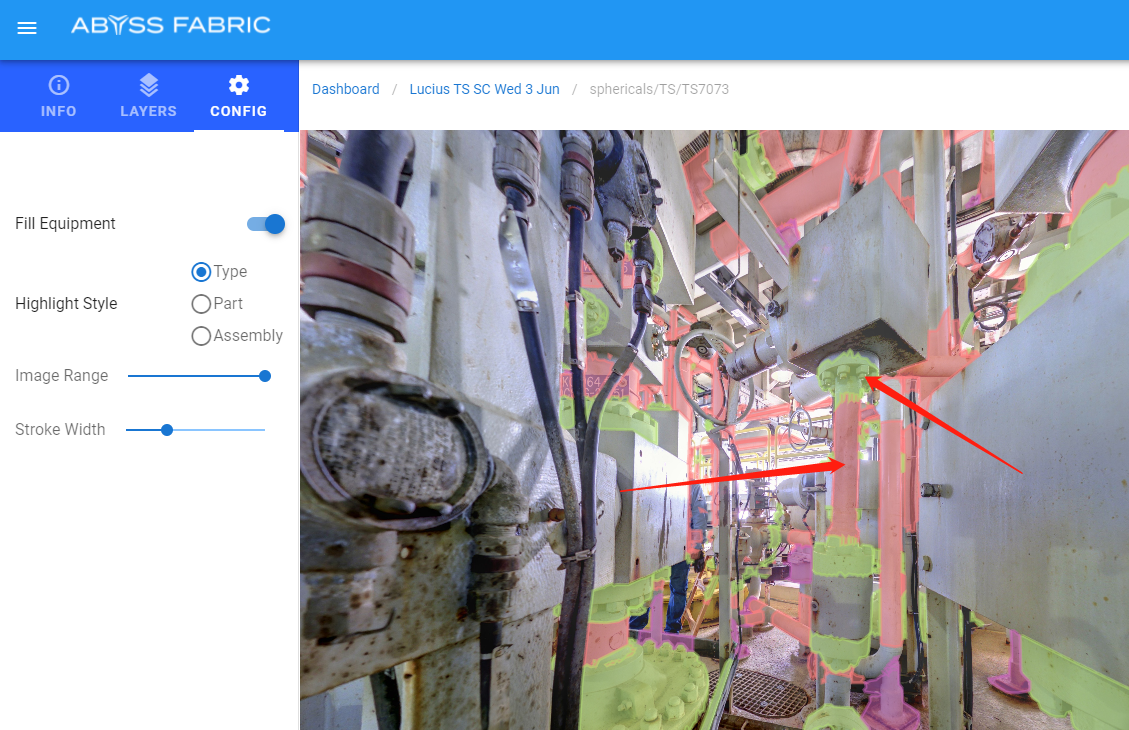
Highlight style: Type
This highlight mode will mark all parts which have the same type in the same color, helping users to tell different types of parts in the viewer better.
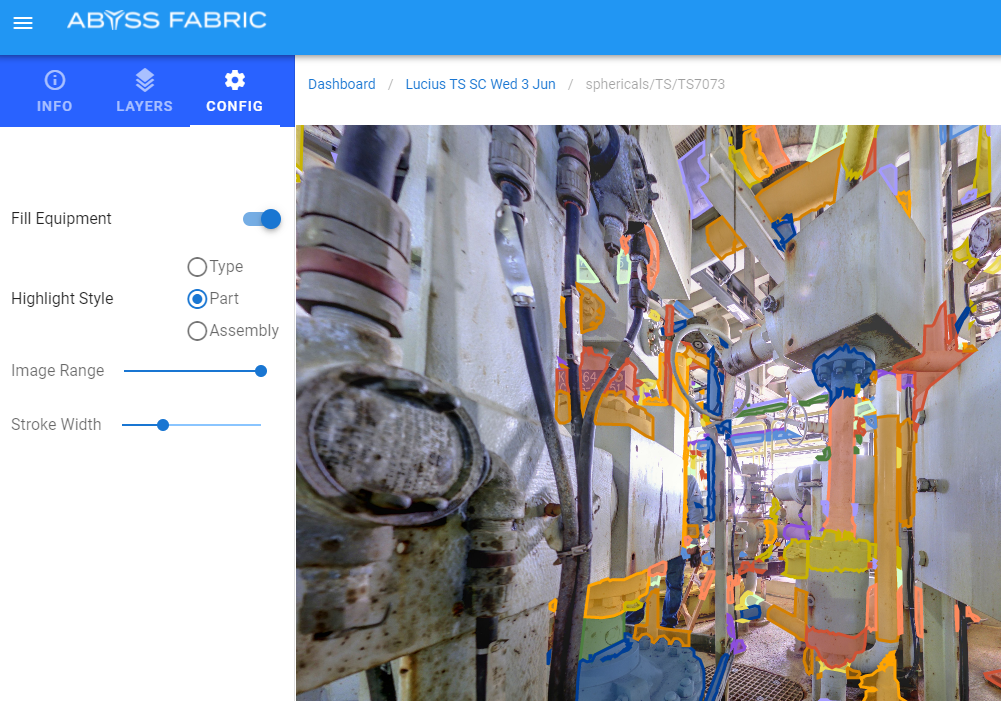
Highlight style: Part
This highlight mode out stands each individual parts, making it clearer where each part is.
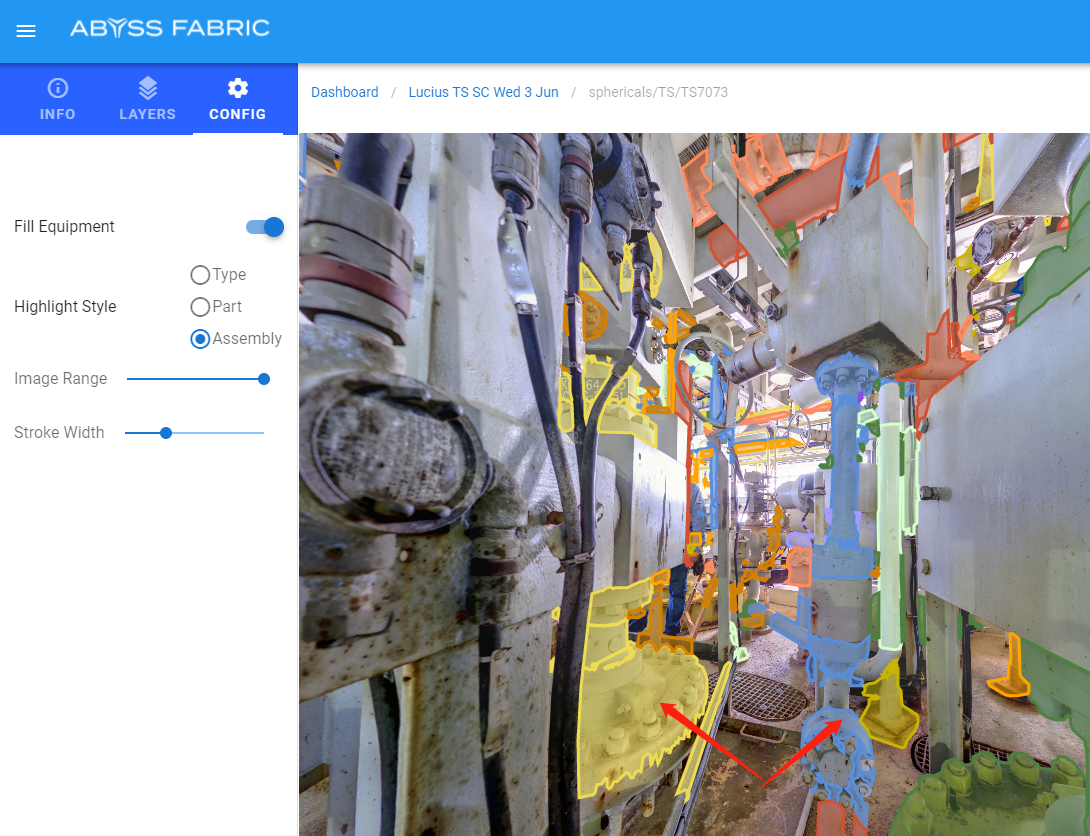
Highlight style: Assembly
This mode marks all parts which on the same assemble in the same color, helping users to recognize different assemblies.
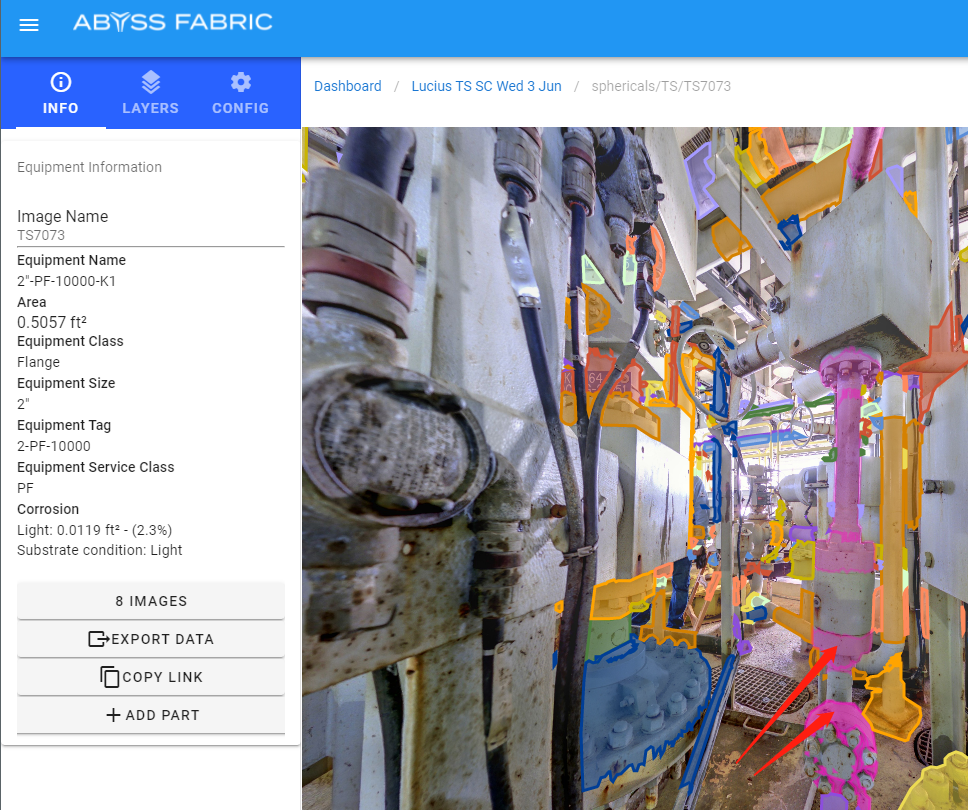
All highlight mode would have Magenta color to identify the selected part, at the same time, a more transparent Magenta color would be used to identify parts on the same line.
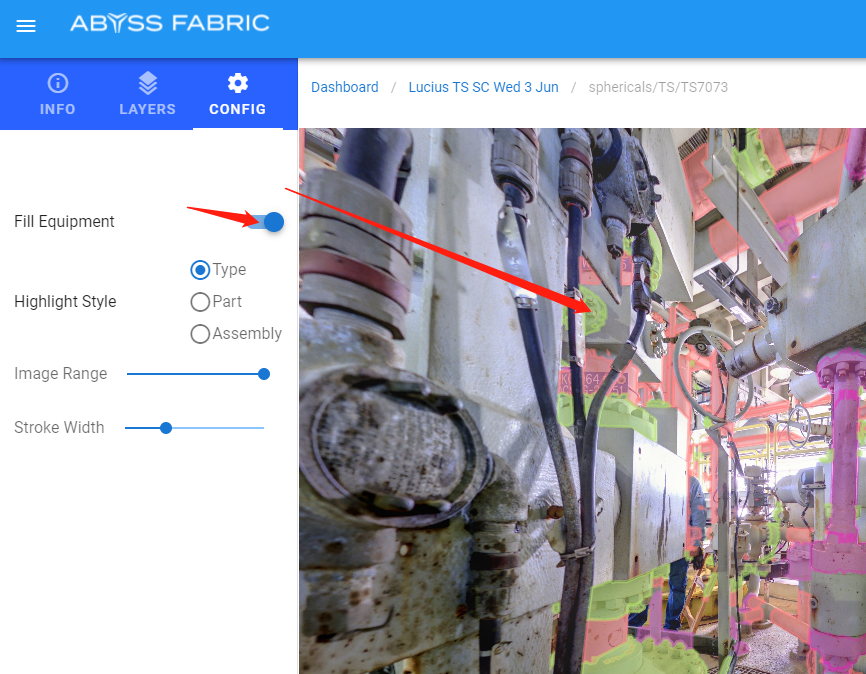
Highlight filling
In the Config tab, there is an option to toggle if highlight should fill the surface or only outline should be used.
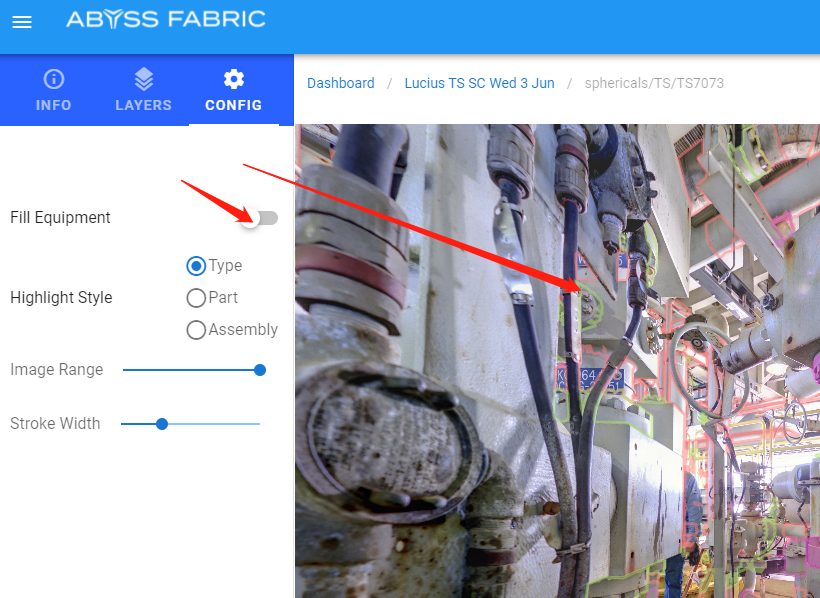
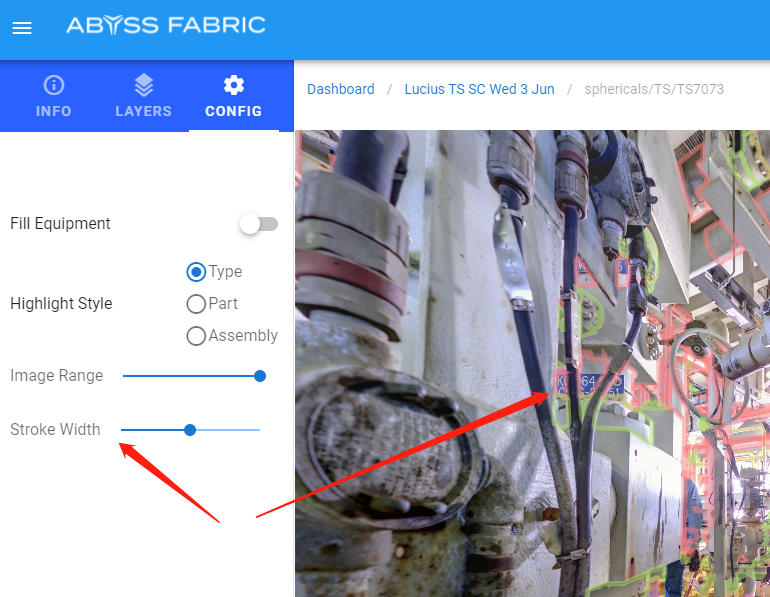
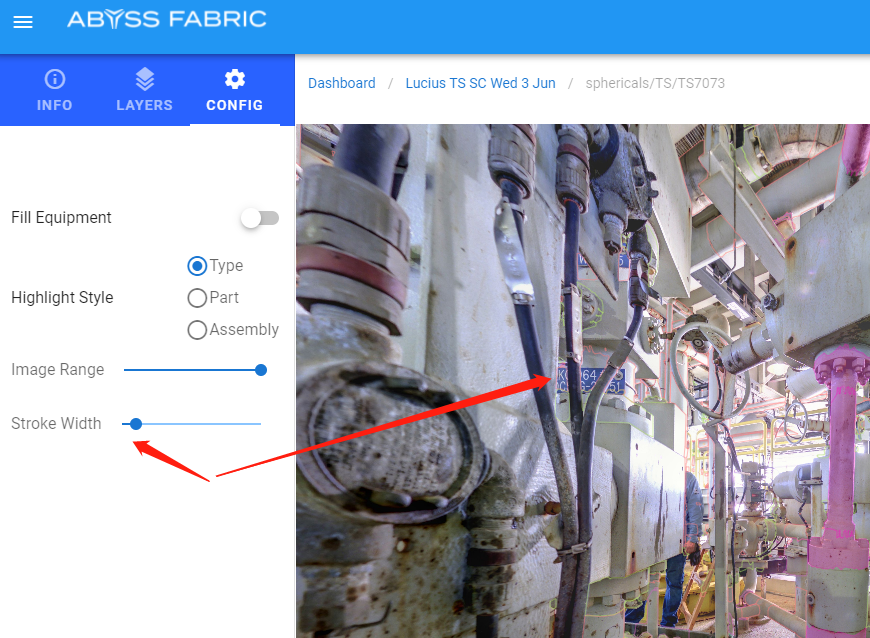
Highlight stroke width
In the Config tab, an option for the thickness of stroke width is also provided. Users can use this feature to set the stroke width as they like.
Add item to work pack
To add an item to a work pack, you can use the add part button while equipment is highlighted.
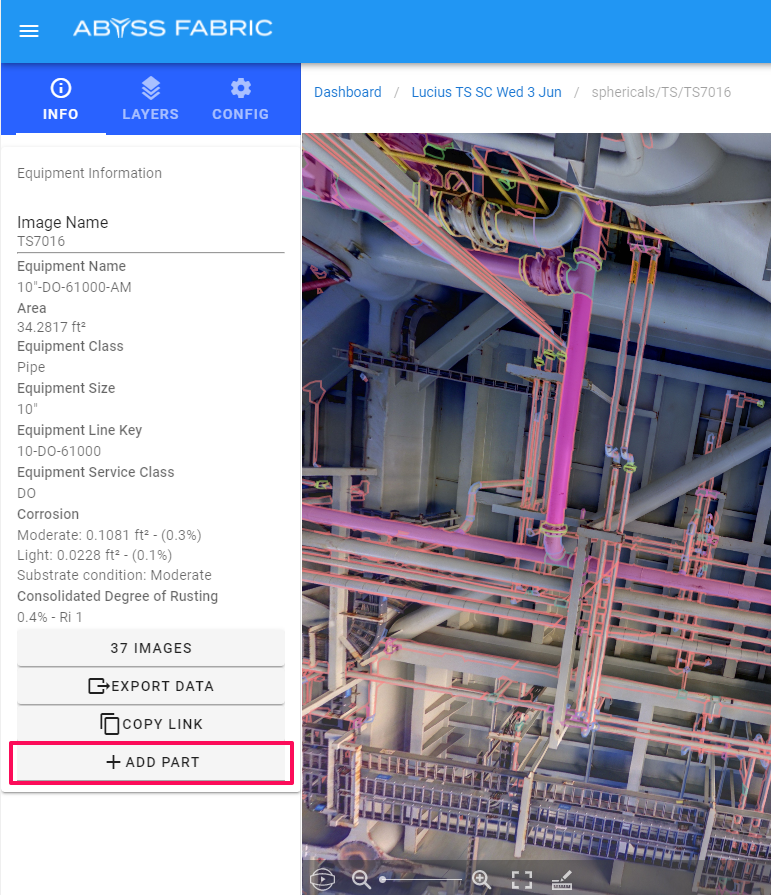
The work pack item will have your current viewing angle and zoom saved. When you click the add part button a form will open allowing you to select which work pack to add the part to.
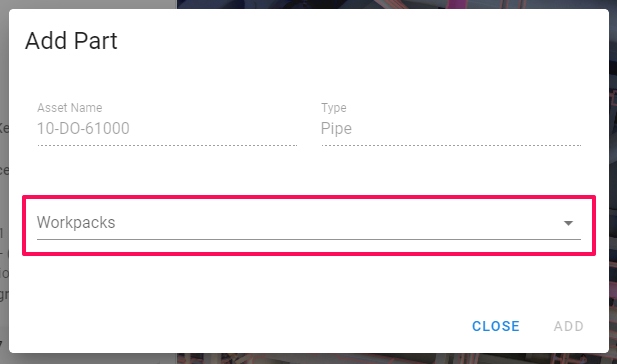
Depending on the type of selected work pack, you will be given additional options.
All work pack items have the option for adding a comment with the work pack item.
Paint work pack
If the selected work pack is a paint work pack, then you can add the paint area
Construction work pack
If the selected work pack is a construction work pack, then you can choose if the parts need to be isolated by closing the upstream valve to allow for work to commence.
Work Packs
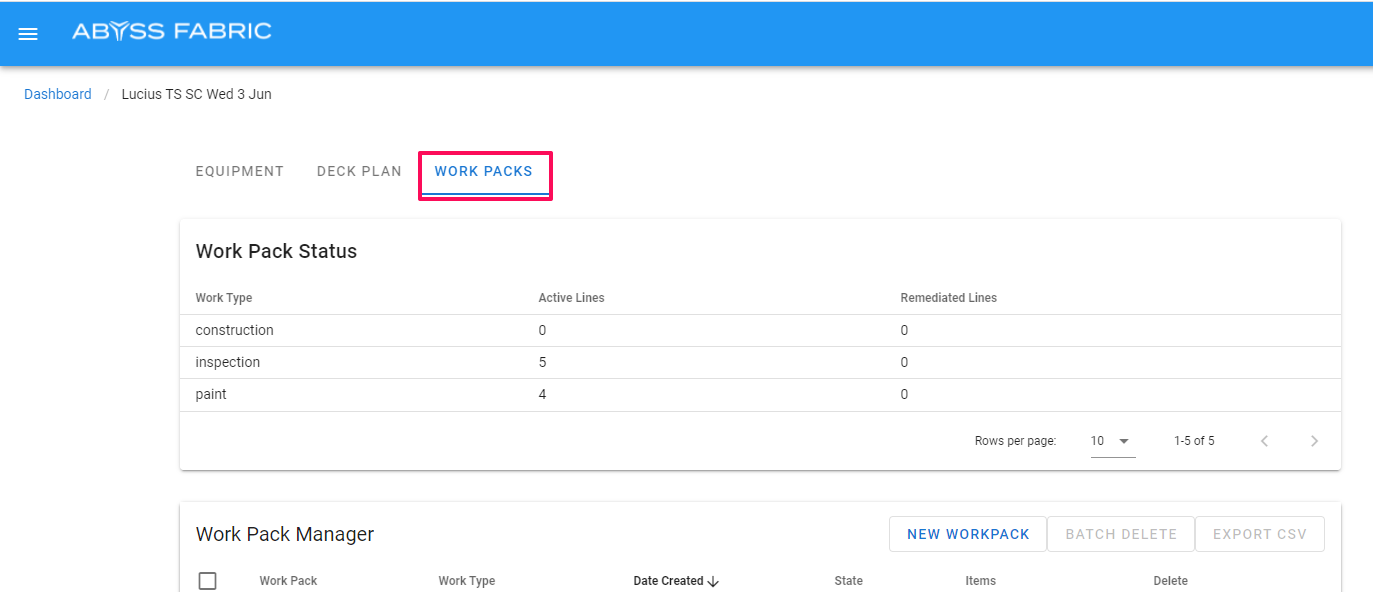
You can access the work packs view by clicking on the “Work Packs” tab.
Work pack status
To get an overview of the status of work packs for a platform, you can use the “Work Pack Status” table.
Active lines represent the number of Lines with work yet to be validated by a supervisor, and Remediated lines represent the number of lines where the work has been signed off by the supervisor.
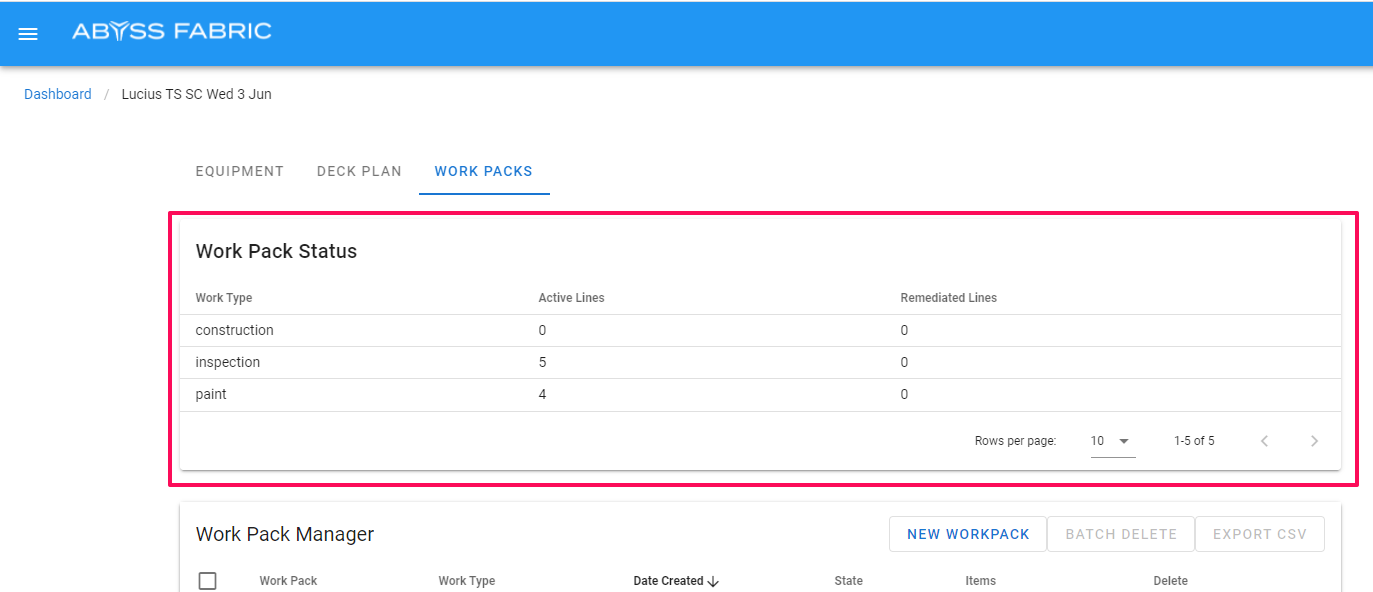
This table shows the number of active lines and remediated lines in relation to different types of work packs.
Workpack Manager
Work pack states
Work packs can be marked as one of the following states.
Open - Created and being populated with work items.
Fieldwork - Work has been assigned and is in progress.
Review - Work has been completed and is being validated.
Closed - Work has been validated and has been marked as completed.
Create a work pack
In order to create a work pack you can use the new work pack button.
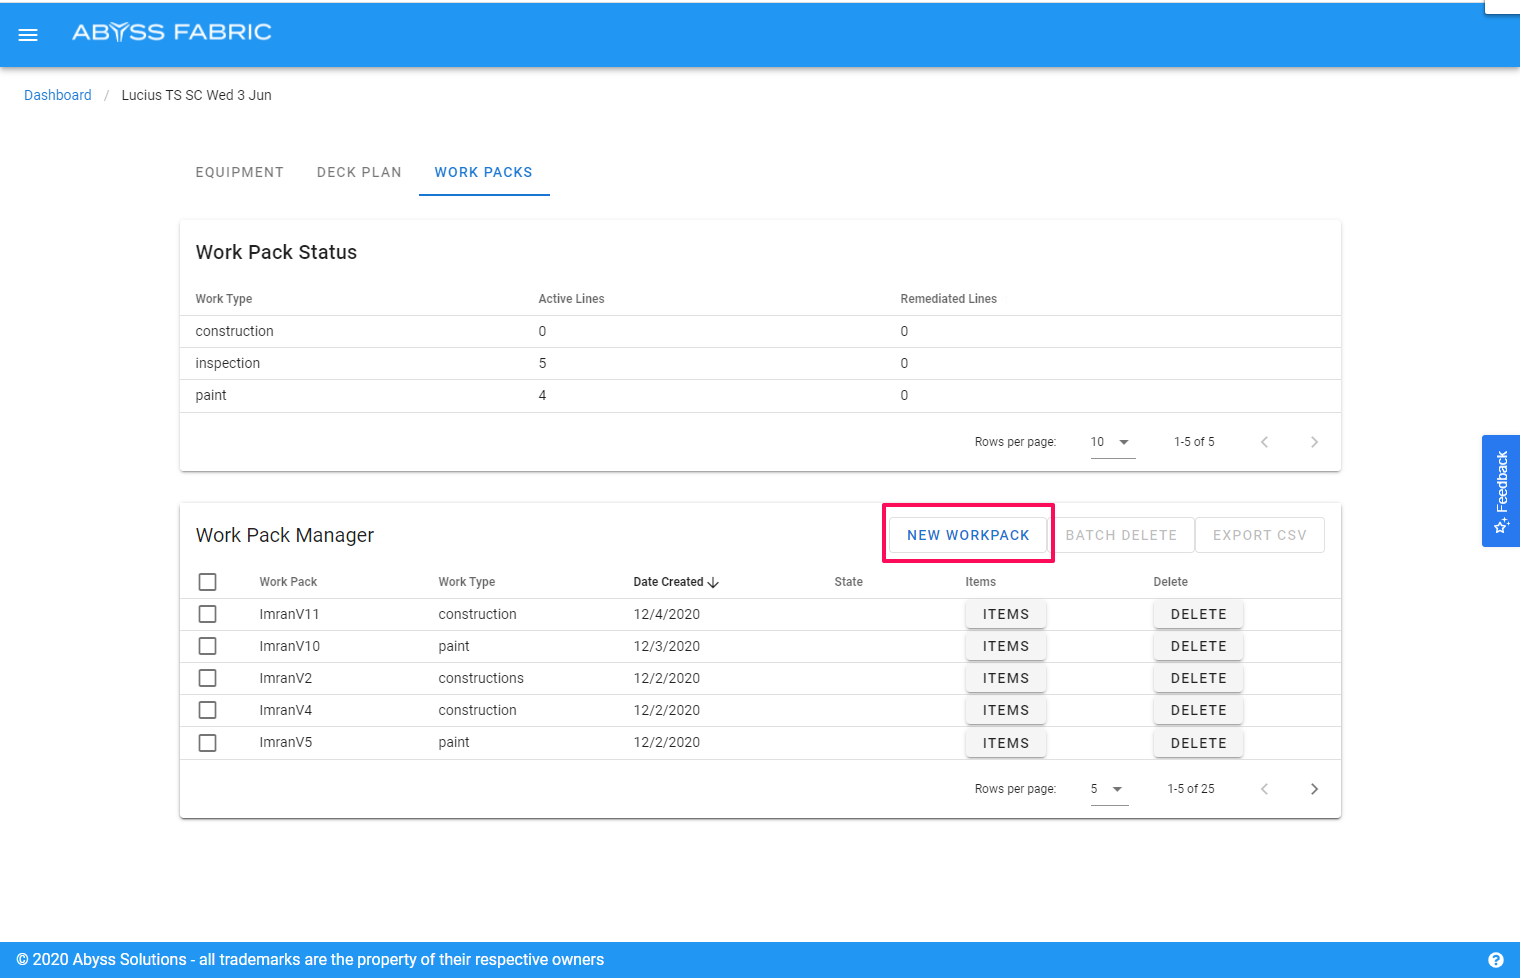
This will open a modal with a form you can use to create a work pack.
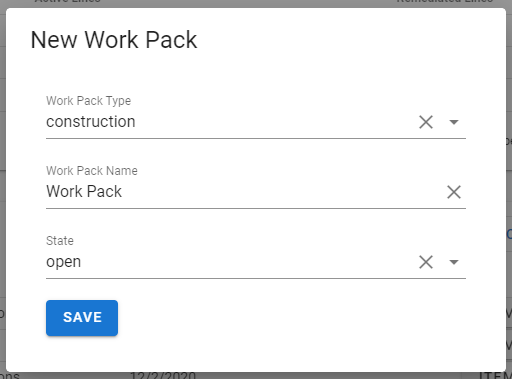
You can select the type of work pack from the drop down.
After you have created your work pack you can add more details. The details that you can add will be different depending on the type of work pack you have selected.
You can view the work pack details and items by clicking the items button in the work pack manager table.

Edit work pack
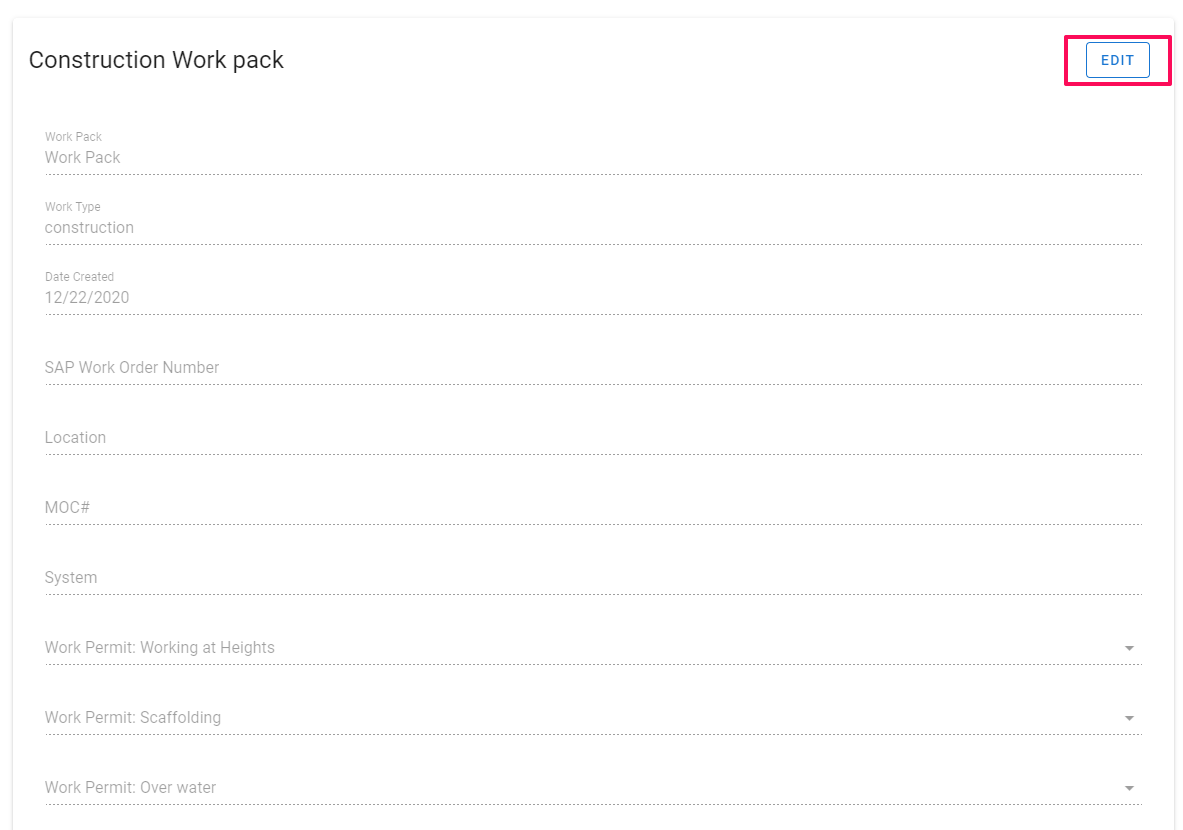
You can edit the details of the work pack by clicking the edit button on the work pack details view.
The fields in these forms are configured according to the framework agreed upon with Abyss.
Work pack items
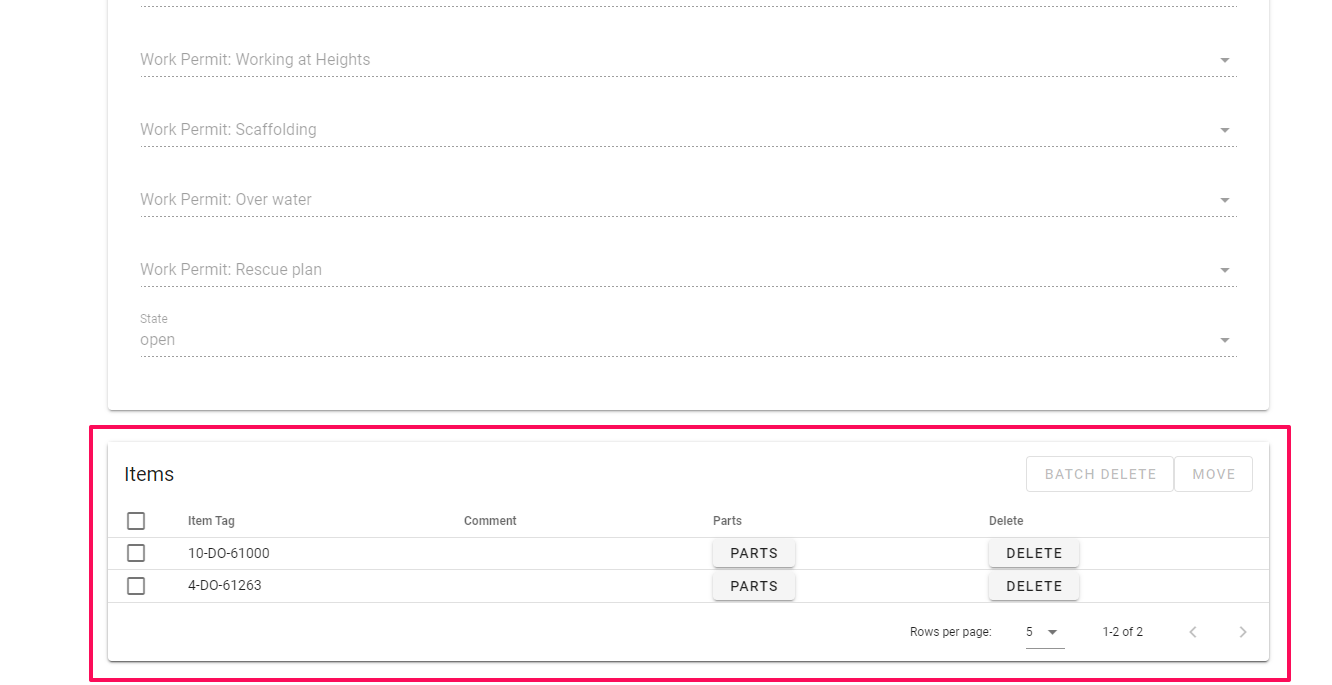
Once items are added to work packs, you can view them in the work pack details view.
Delete items
You can delete items by clicking the delete button on the item you want to delete.

You can also select multiple items and use the Batch Delete tool.

Move items
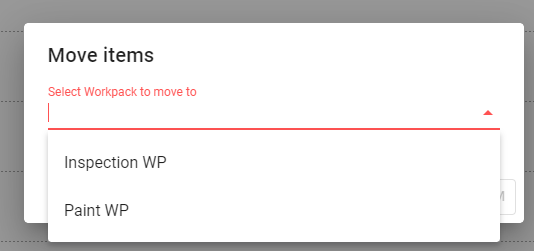
You can select multiple items and move them to other work packs using the move tool.

Clicking the Move button will open a modal where you can select other work packs to move items to.
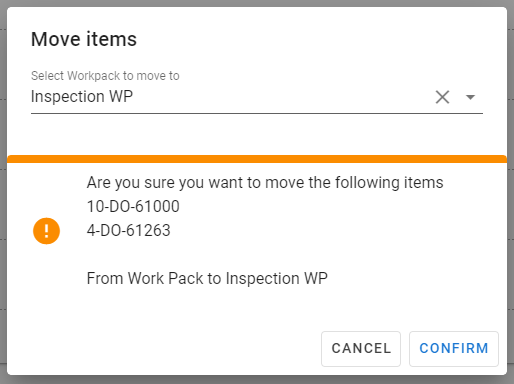
Once you have selected the work pack it will show you a confirmation page. Click confirm to move the items from the existing work pack to the new one.
Item view
There can be multiple parts that need work on a work pack item. To view the parts click the Parts button.

This will take you to the Item view which has a table with a list of the parts associated with the work pack item.
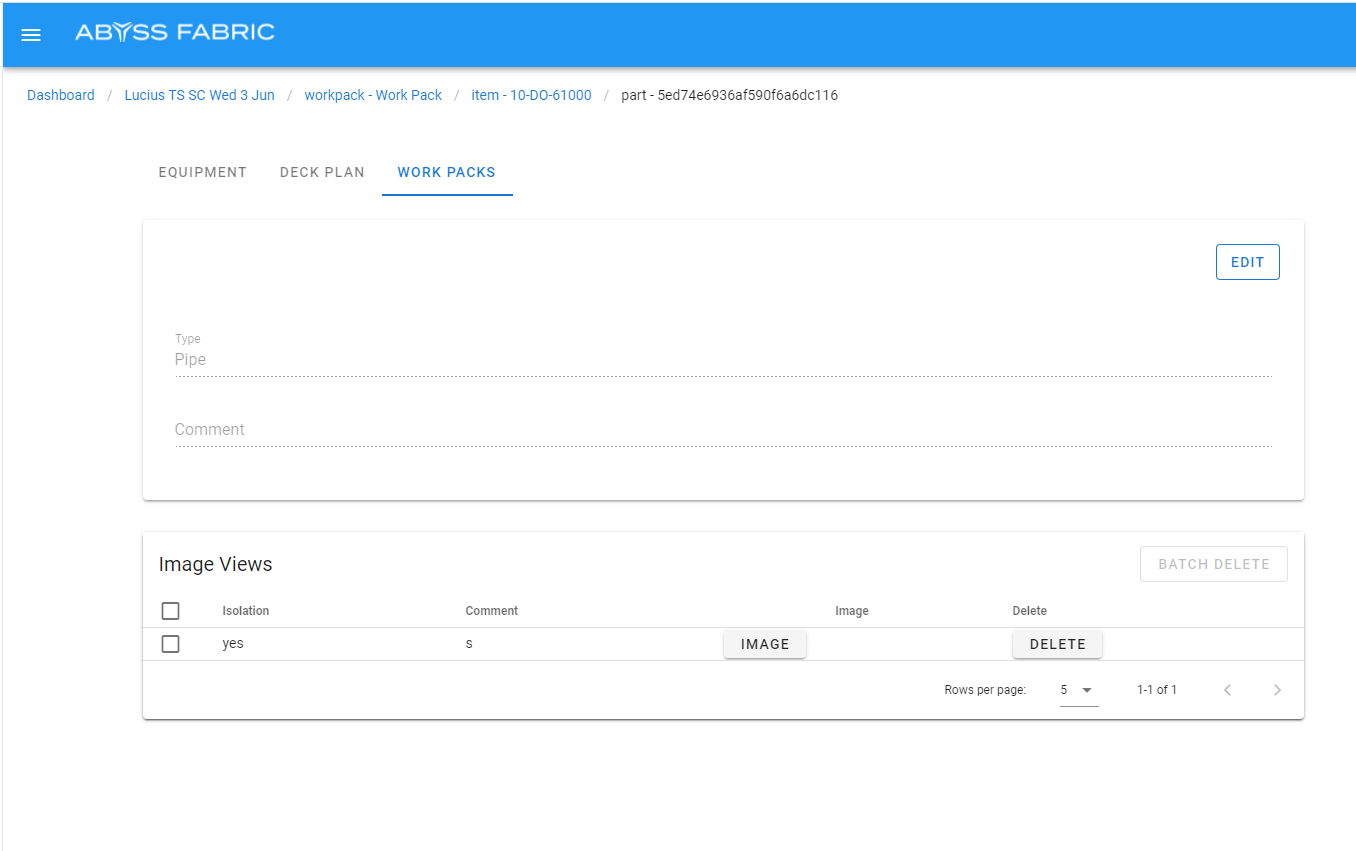
Here you can edit the work pack item, delete views associated to the item or click the image link to be taken to the spherical viewer with the same view that the part was added through.
Add an item
Click here to see how to add an item to a work pack using the spherical viewer.
Exporting
Equipment List export
You can export data available in the equipment table by clicking the Export Results button.
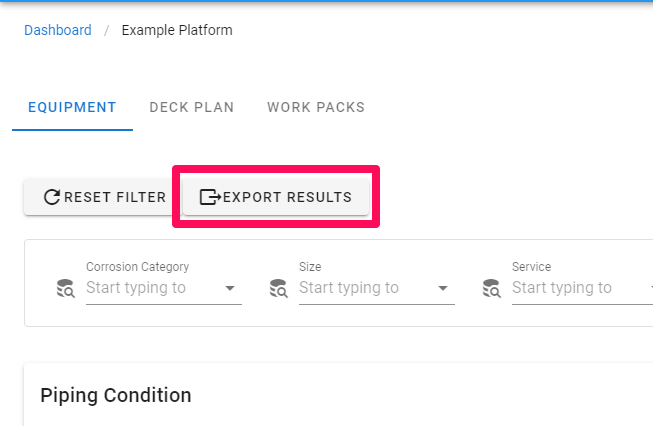
This will export data related to the current filtered results.
Part details export
You can export data related to your selected part, using the part detail modal’s export data button.
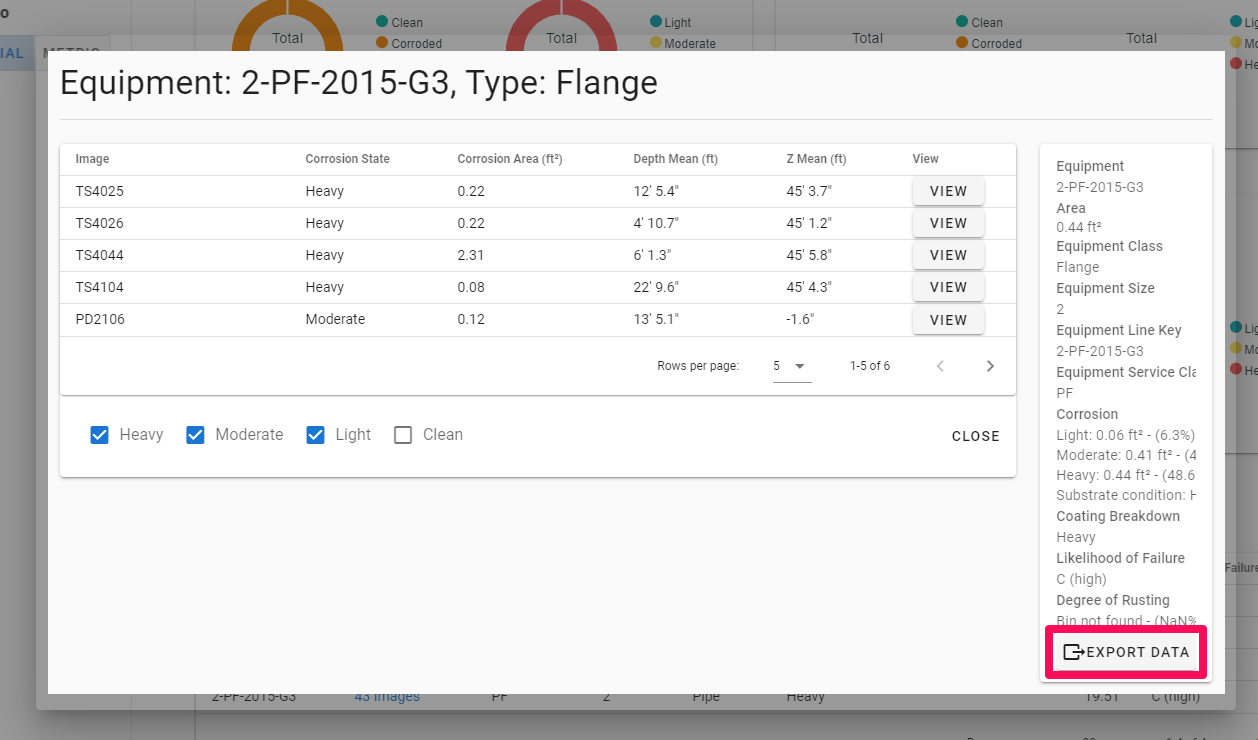
Spherical selected part export
You can export data related to the currently selected part on a spherical by clicking the Export Data button.
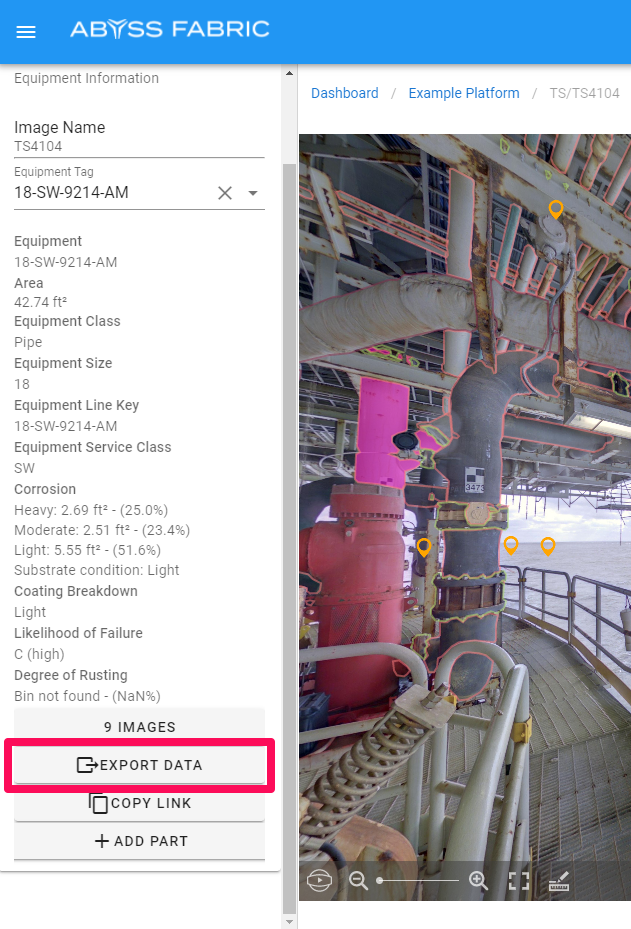
Feedback
Anywhere in the application you can send feedback using the feedback tool.
To start using the tool click the feedback button on the right hand side of the screen.
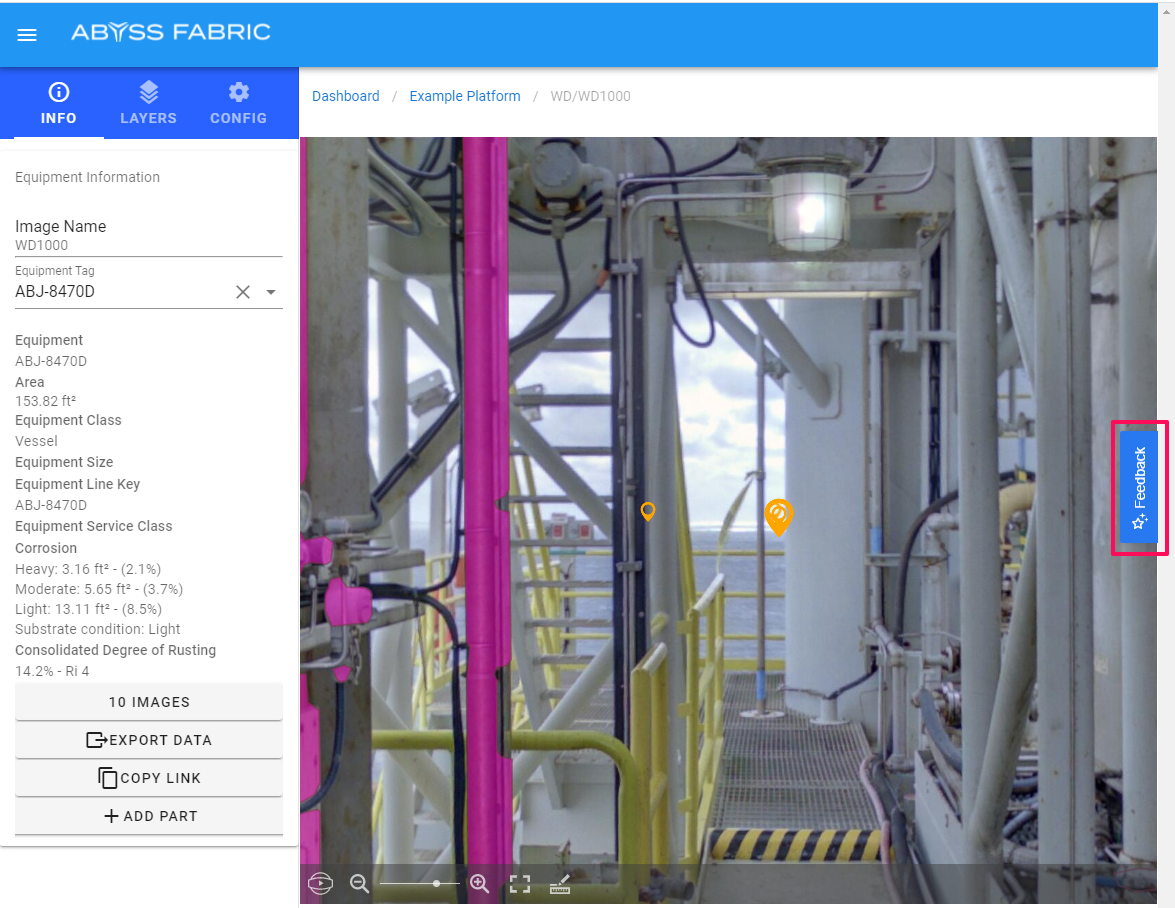
Using the Annotation Tool

The annotation tool lets you draw on the screen with a variety of tools.
To start drawing, simply select the tool and then [click + drag] your mouse to draw on the screen.
Box - Highlights a specific area of the page.
Pencil - Draw anything you like! Circle, point, works great with a touch screen and pen.
Line - Underline, strikethrough, draw a straight line.
Arrow - Point to something.
Blockout - Blocks out any sensitive information on the screen.
Text - You can also drop a pin and add a text comment anywhere on the page.
Hint: You can also drop a pin comment anywhere on the page just by clicking your mouse.
Once you’ve finished annotating your screenshot, simply click the Next button to continue to the next step in the widget.
Feedback Widget
The Feedback widget allows you to collect additional information via a standard comments box.
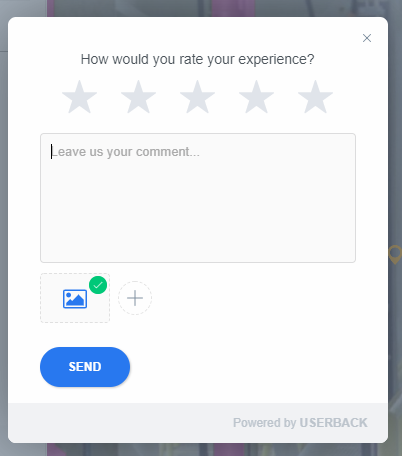
Additional Screenshots
Add up to 3 screenshots with your feedback by clicking the [+] icon.
Attachments
Attach files up to 2MB in size with your feedback.
