Spatial Query
Overview
This guide provides a step-by-step walkthrough for users to view, prioritize, and generate work scopes in the Viewer tab of Abyss Fabric. We will use the example of 10m custom blocks to illustrate the process.
Step 1: Accessing the Blocks List
Go to the Viewer Tab in Abyss Fabric.
Click on the 'Blocks' option on the screen's right panel.

Once clicked, a list of blocks will appear.
There are two types of blocks:
Default Paint Blocks (standard paint blocks)
Custom Blocks (vary based on the platform)

Step 2: Selecting the Custom Blocks
Locate and click the '10m Block' option from the block types.
The list will display all 10m x 10m x 10m dimension blocks available.
In this example, there are 330 blocks.

Step 3: Prioritizing Blocks Based on Criteria
Choose a prioritization criterion from the dropdown list.
Select RI4 + RI5 as the prioritization criteria.

Ensure sorting is enabled:
Click the arrow icon to sort the list in descending order.
The block with the highest sum of RI4 + RI5 will appear at the top.

Step 4: Visualizing the Selected Block in 3D
Checkmark the selected block from the list.
This will highlight the block in the 3D viewer.

It is recommended to adjust the visibility settings to match the prioritization criteria for an optimal view.

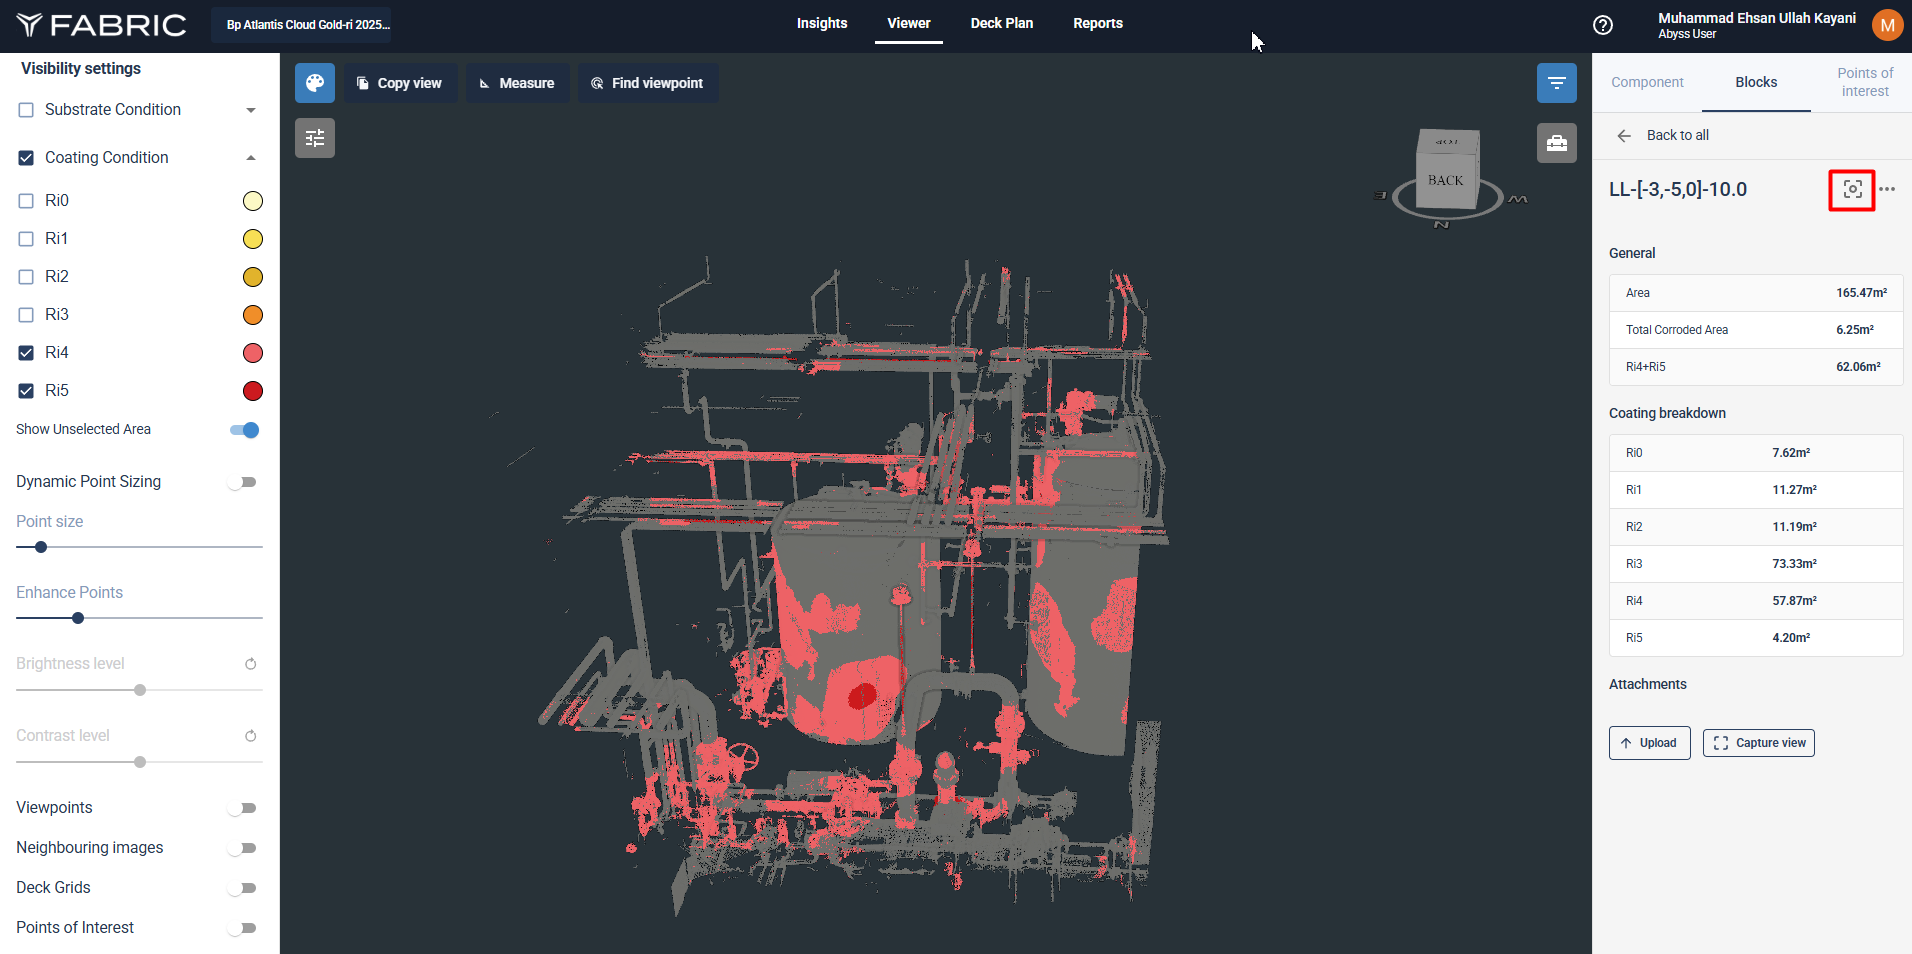
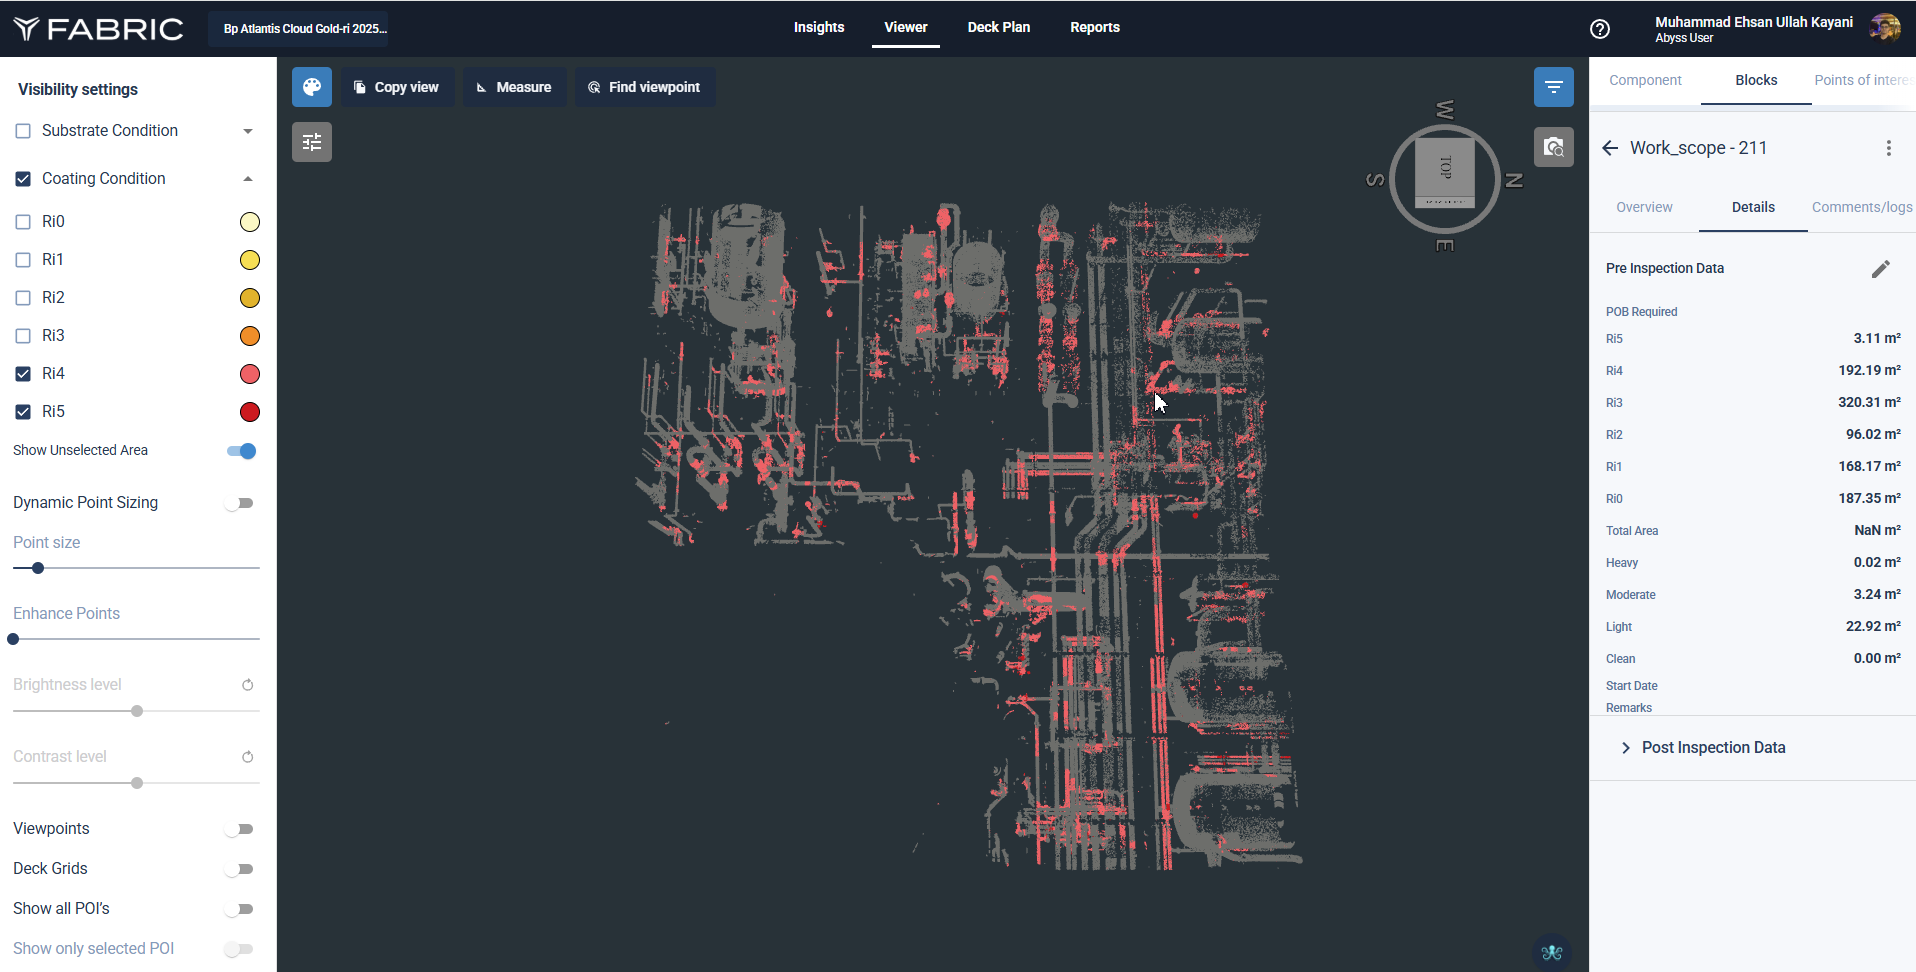
Step 5: Opening the Block in an Isolated View
Click on the selected block name in the list view.

This will open the block in an isolated view.
The detailed information panel on the right will now display:
General Information: Total block area, corroded area, and the sum of RI4 + RI5.
Coating Condition: Breakdown of RI values.

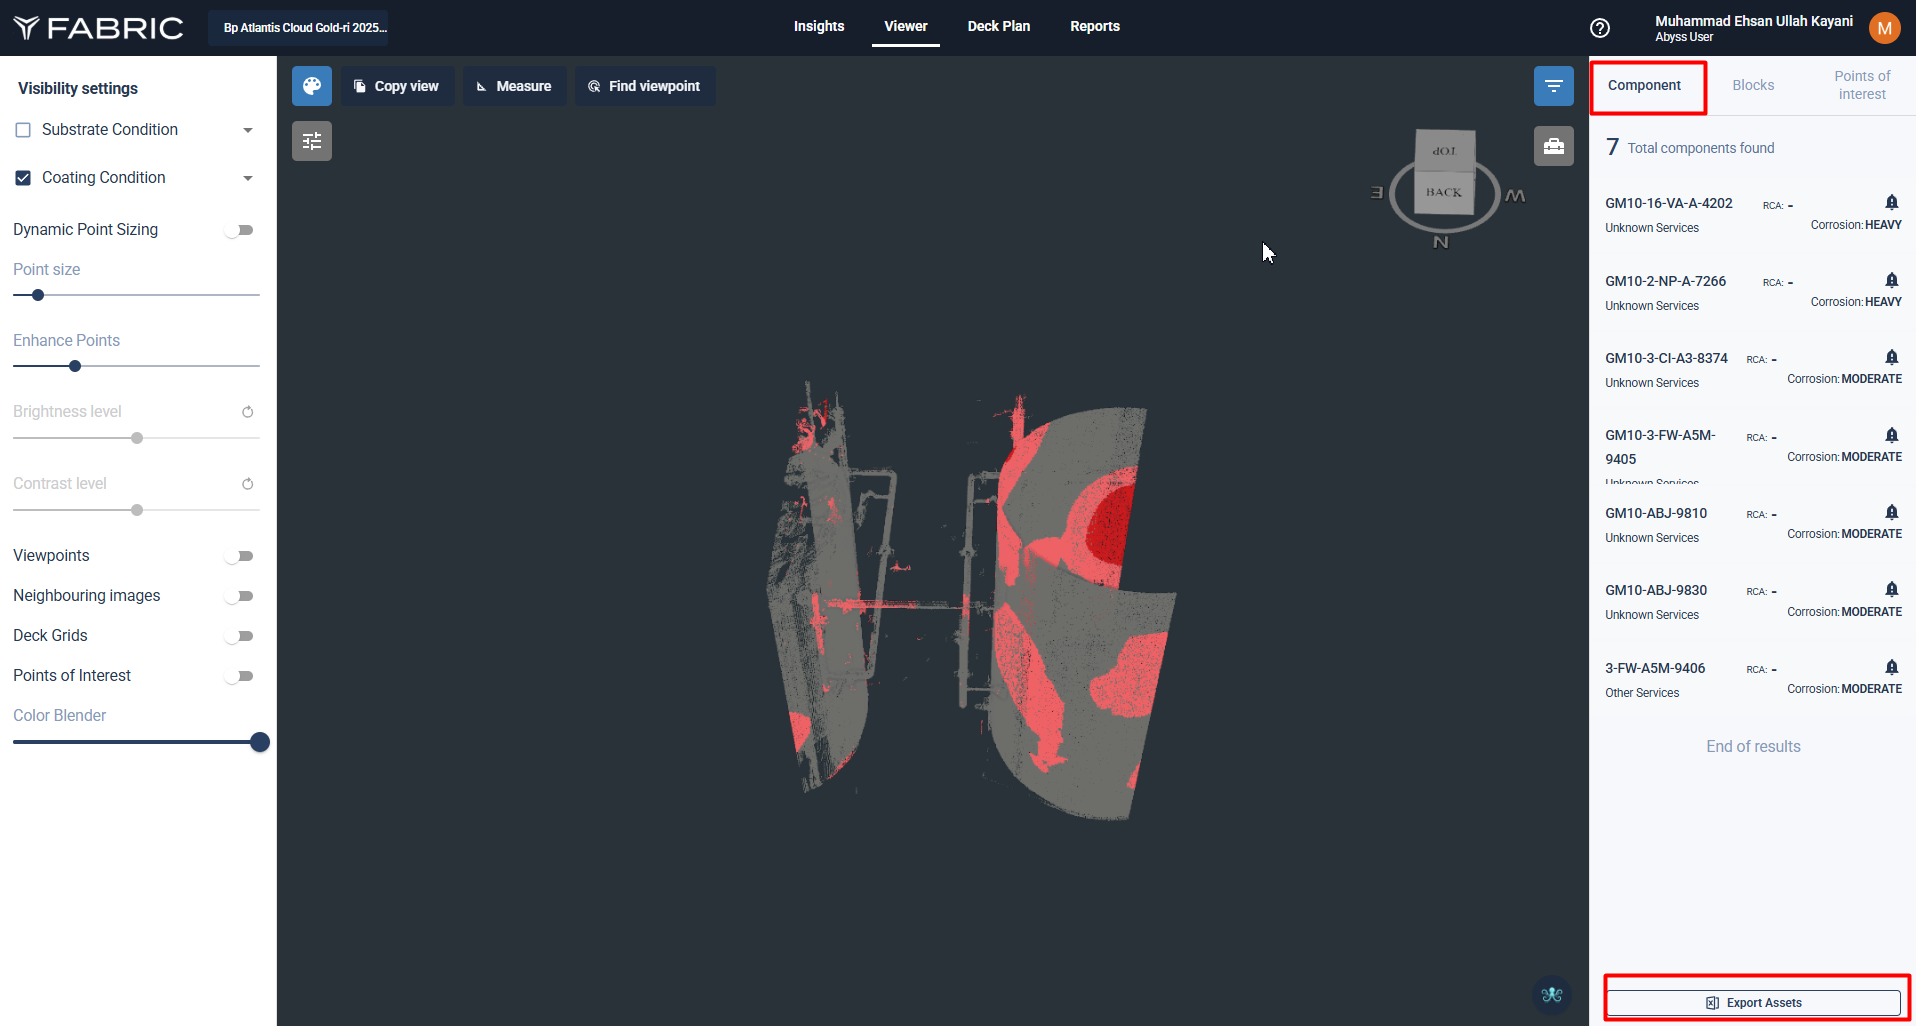
Showing associated components with the block
Once in the isolated view, click on the Component bar to view all the assets associated with the block.

Exporting Custom Block Data
Using the export function, the user can also export component information for a custom block.

Clicking the "Export Assets" button will open a prompt. Select the desired columns for the Excel export file, then click "Download."


Step 6: Visualizing Multiple Block Sizes Simultaneously
Users can enable multiple block sizes simultaneously, allowing for a more flexible and comprehensive view. The number of block sizes that can be activated simultaneously is unlimited, enabling better comparison and prioritization across different dimensions.
The user can check-mark the block that they want to visualize

Step 7: Onsite Image View for Detailed Inspection
Users can access onsite image views of identified corroded spots for a more detailed inspection. This allows for a closer examination of defects, helping teams make informed decisions about necessary maintenance and repairs.
The Find Viewpoint feature is recommended for detailed inspection of corroded spots.
Click the Find Viewpoint button

Select the point cloud spot you want to inspect onsite.

Click on the Image thumbnail that is ideal for inspection


(Optional) Enable the Viewpoints toggle from Visibility Settings to assist in locating and viewing specific spots. Click on any beachball to go onsite

Step 8: Creating / Refining a Custom Work Scope from a Selected Block
Once a block is isolated and reviewed, users can refine the region of interest by creating a custom work scope.
Click the “Add Work Scope” button in the right panel. This will generate a resizable cube around the selected block area.
The cube can be manually adjusted by dragging any of its six faces to fit the precise boundaries required for maintenance or inspection. As resizing occurs, the Area fields update in real time. Resizing is done in fixed increments of 50 cm in the XY plane and 1 m in the Z plane.

Once resizing is complete, click the “Done” button to proceed.
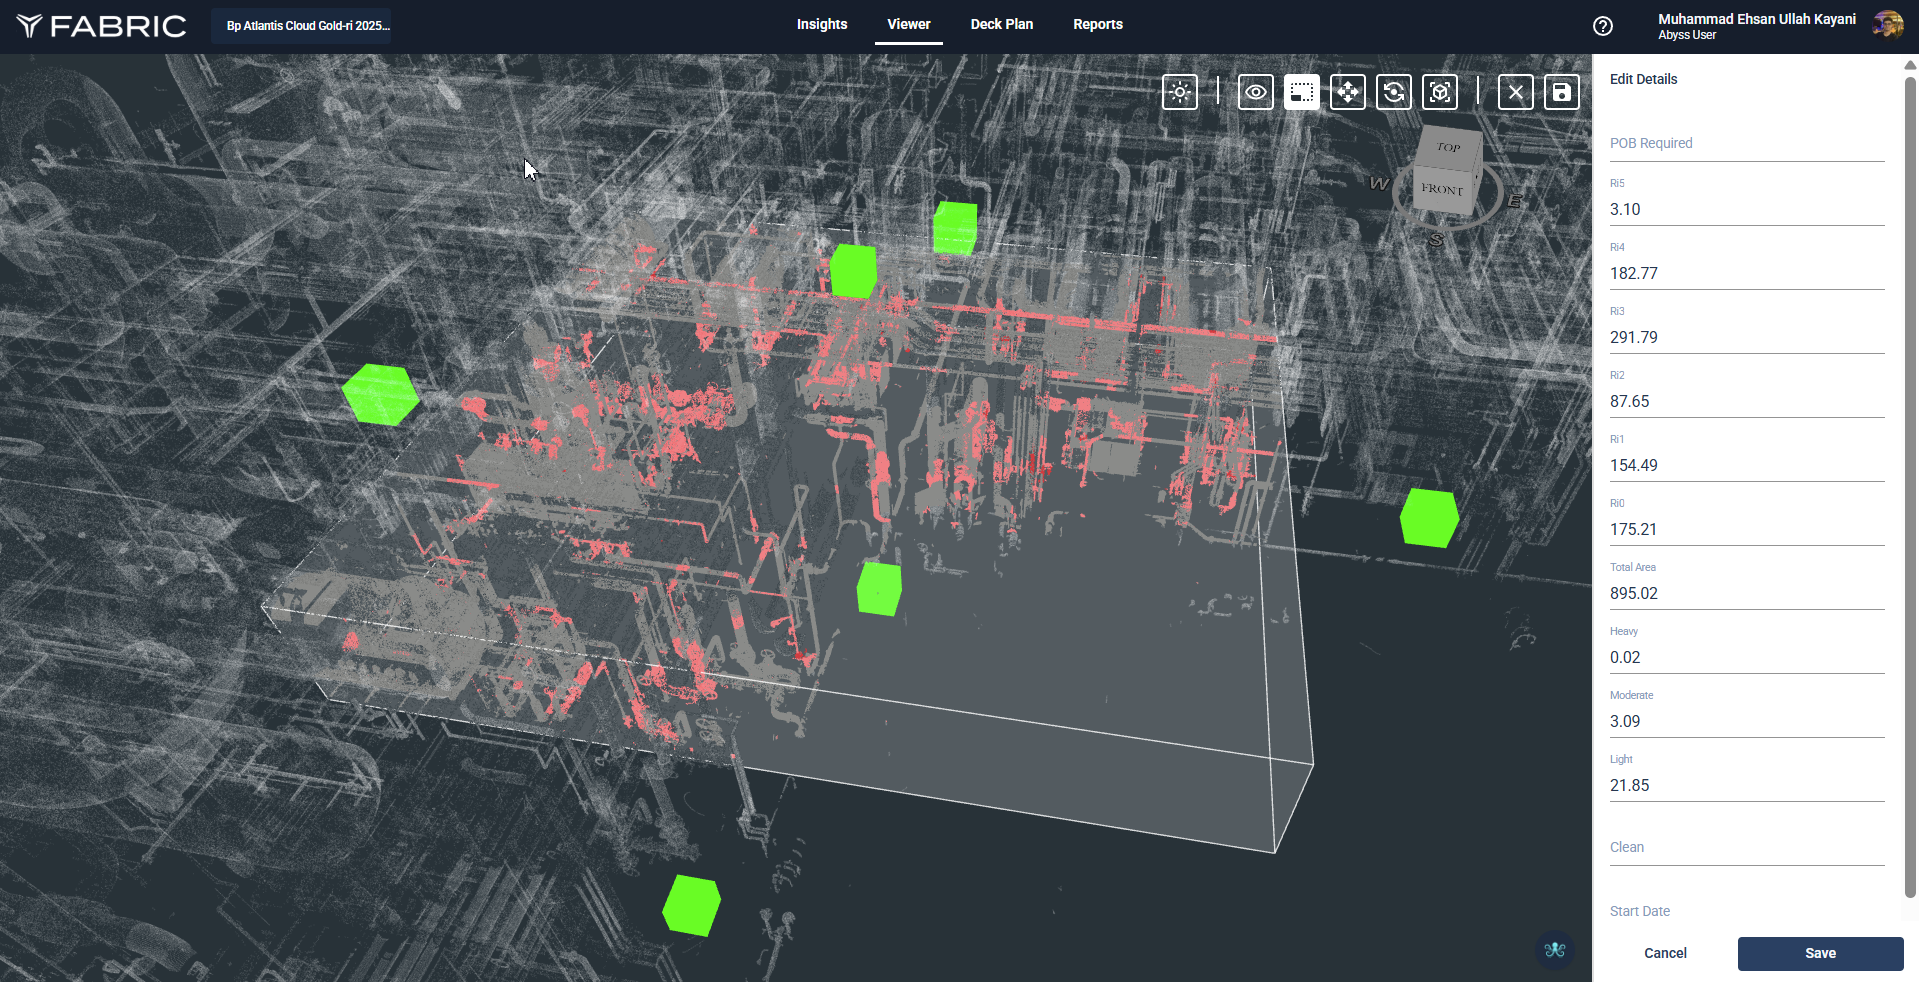
Step 9: Entering Metadata and Saving the Scope
After resizing, the scope enters Isolated Mode, and the side panel is active. The side panel includes:
Metadata Fields: Add information such as POB, start and end dates etc.
Linked Anomalies: A list of all anomalies inside the selected scope.
Scope Area: Calculated dynamically based on the resized block. Users can also overwrite these fields if needed.
Fill out the metadata fields.
Click “Save” to finalize and store the scope in the platform.
The newly created scope is now visible in isolated form and can be re-edited or deleted later.
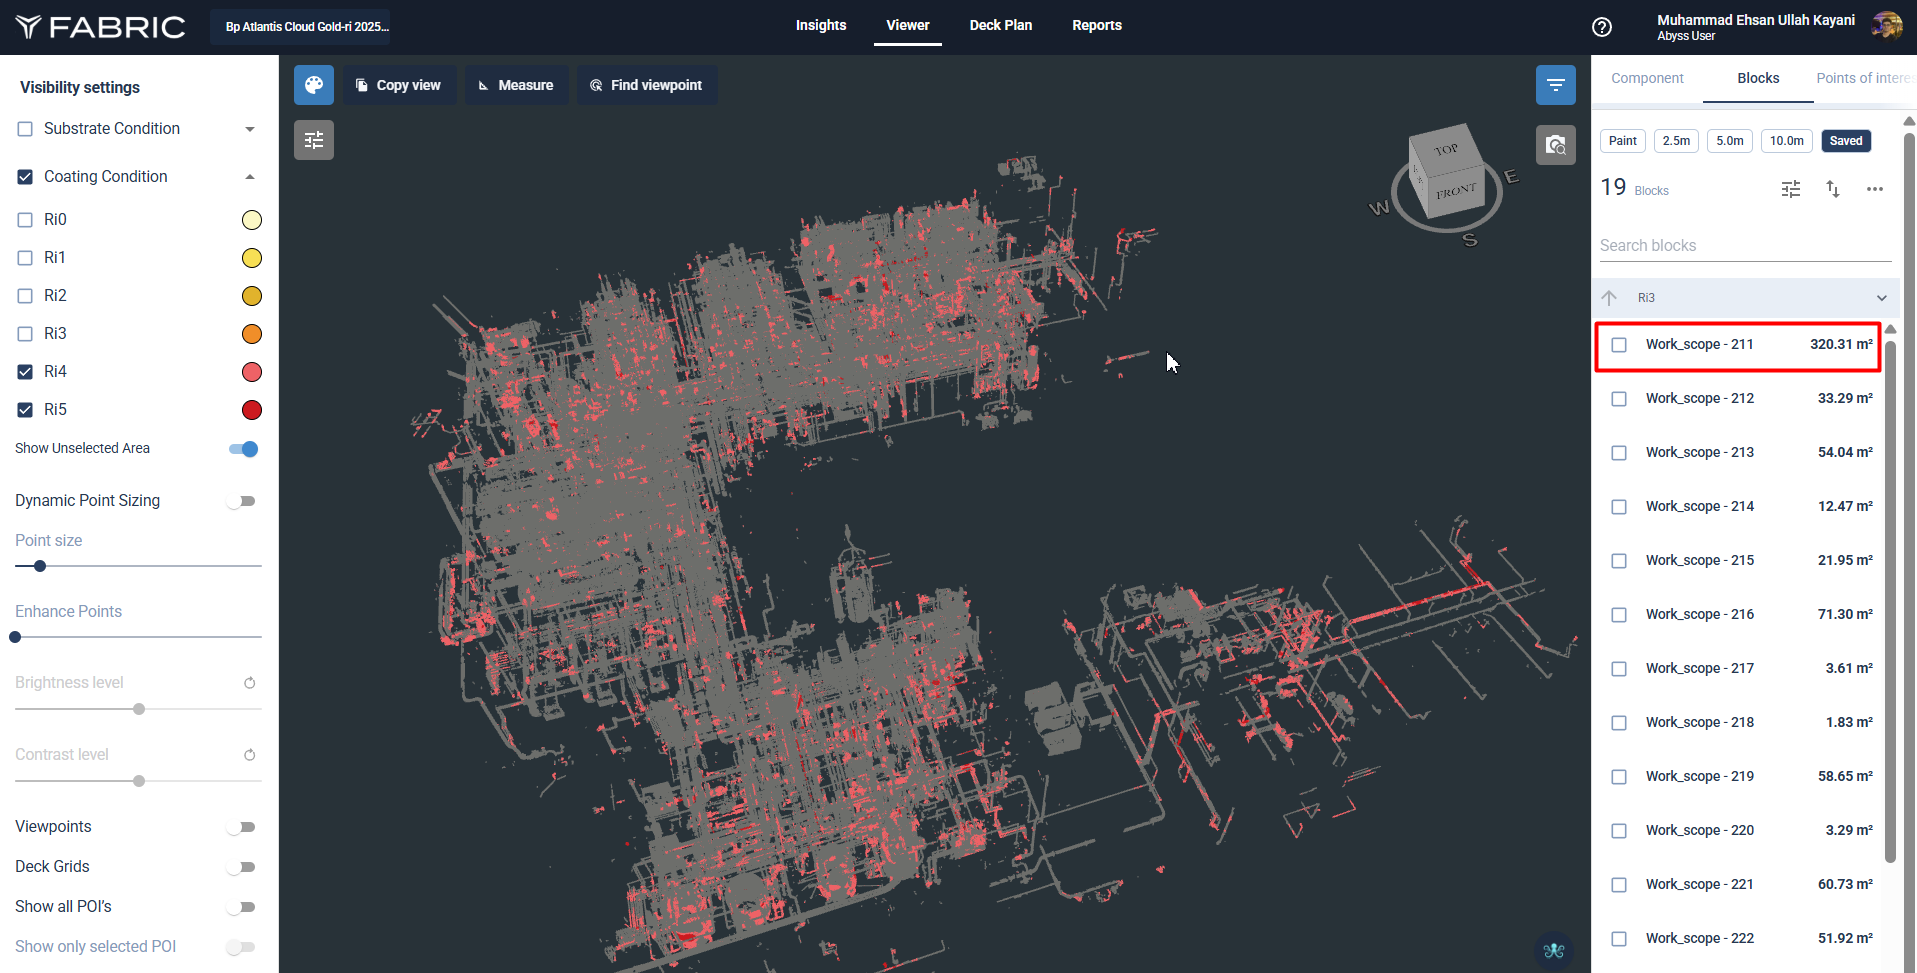
Step 10: Managing and Viewing Saved Scopes
To view all saved work scopes, navigate to the “Saved” tab, next to the Paint Block tab. This tab displays a list of all previously saved and refined scopes. The list now also displays area values of selected parameters. For example, if you choose “Total Area” as the parameter, each saved scope will show its Total Area value in the list view.
To view multiple scopes together, check the boxes for any combination of scopes in the list. Their 3D boundaries will appear in the viewer simultaneously for spatial comparison.
To isolate a specific scope for deeper review, click on its row in the list.
Step 11: Viewing Scope Details and Associated Data
When a scope is isolated, users can inspect its full details:
Point Cloud Visualization: Focused view of the selected scope in 3D.
Scope Metadata: Editable fields.
Linked Anomalies: Complete list of anomalies.
Area Field: Area values, editable if needed.
Click on the “Component” tab to view a breakdown of assemblies and assets within the scope.
Step 12: Exporting Component Data for a Work Scope
From the Component tab, click the “Export Assets” button to export the data.
A prompt will appear allowing selection of which columns to include in the Excel export (e.g., Component ID, Type, Location).
Click “Download” to export the data for offline review or use in planning and reporting tools.