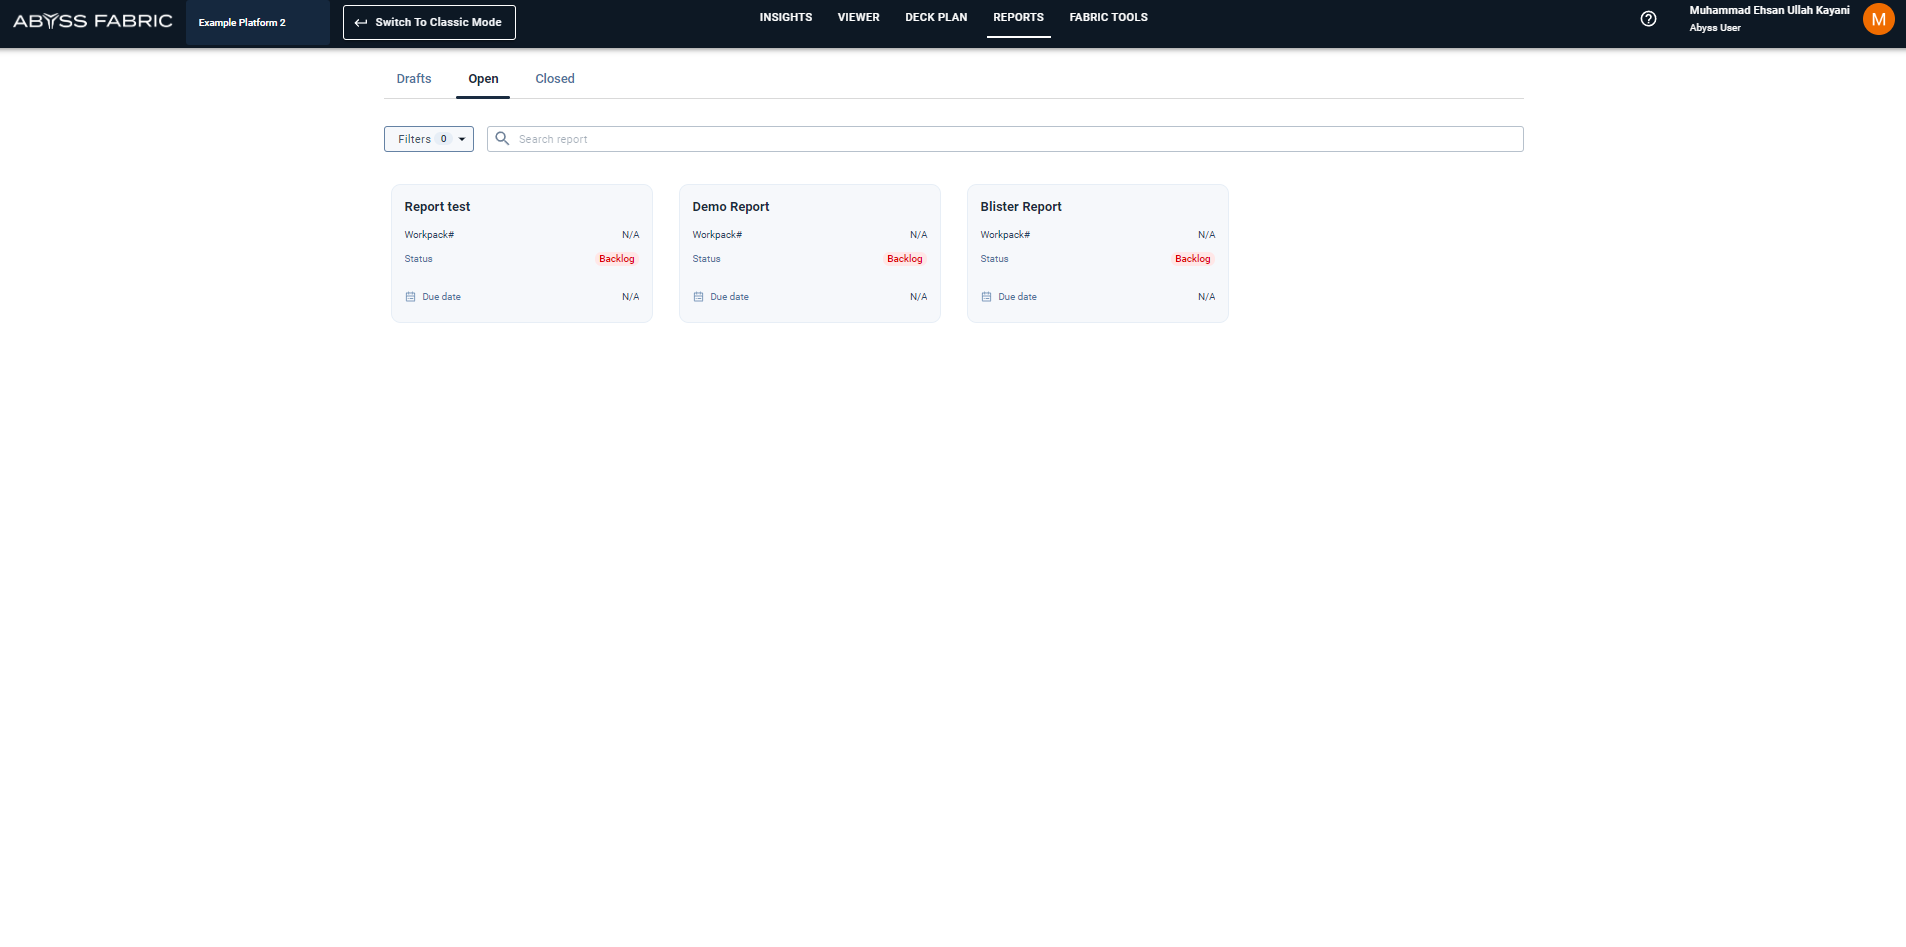
Point of Interest Report
Reports within Fabric can be created in 2 ways
From the POI table
From the Viewer
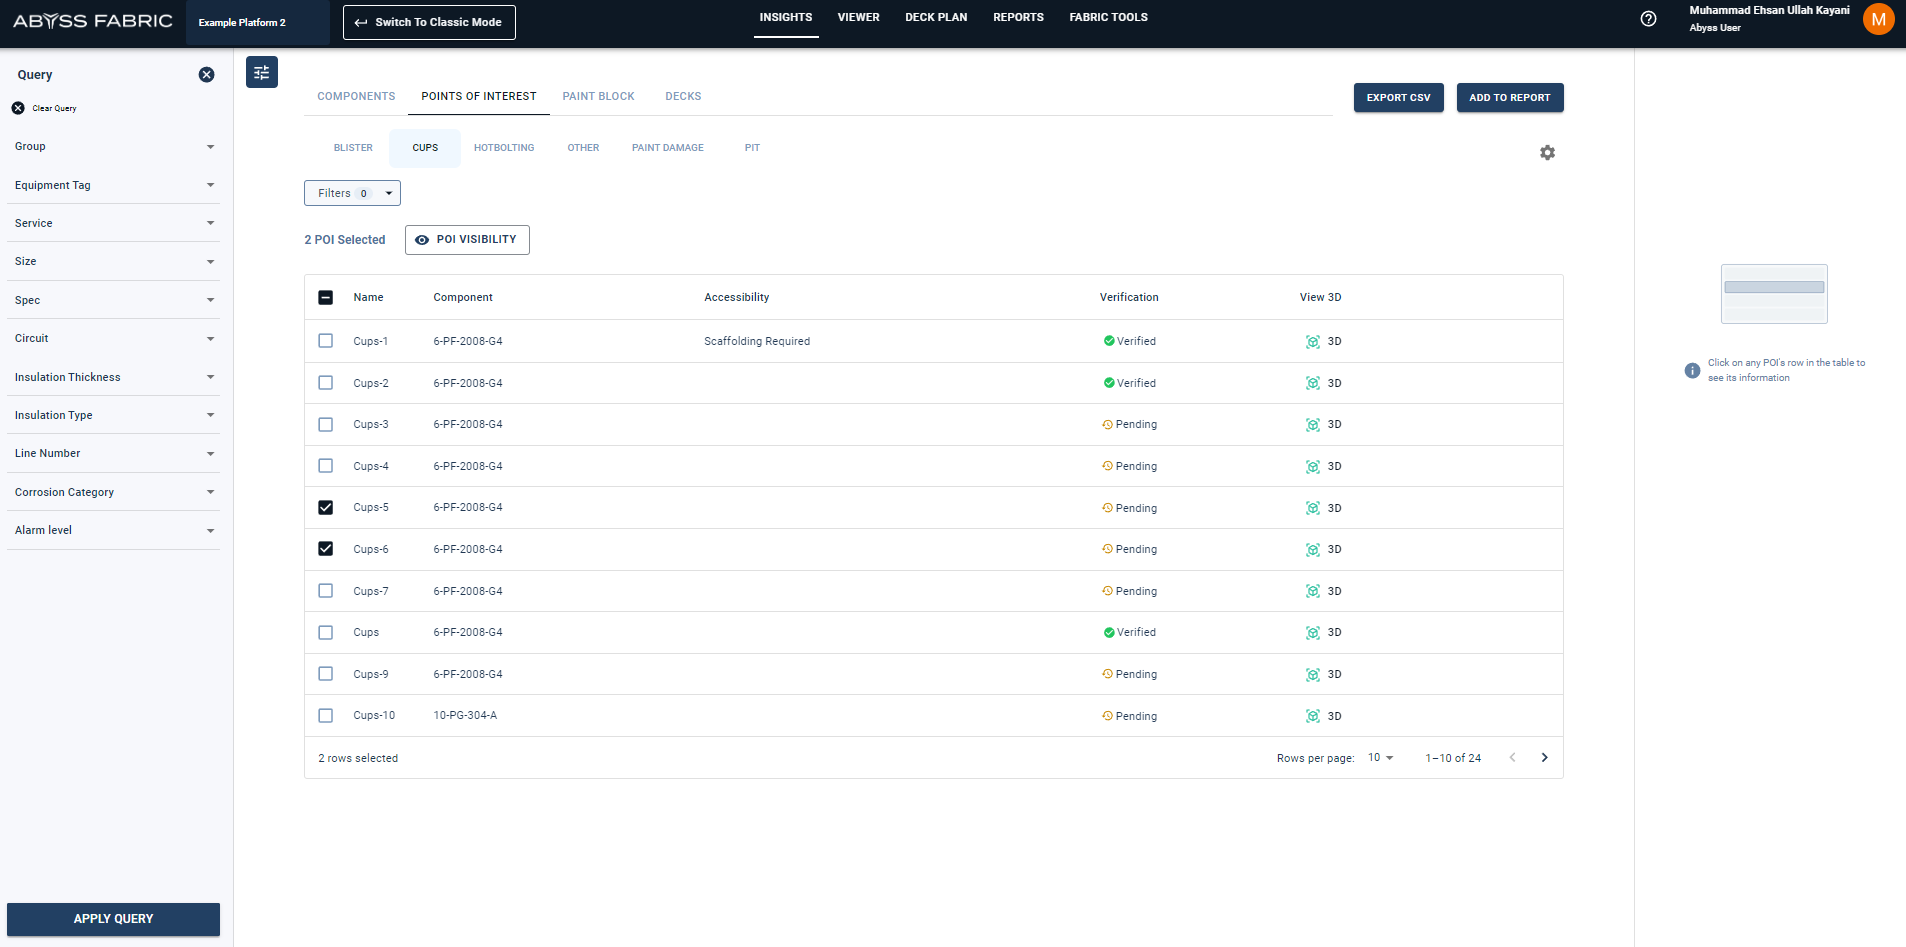
First Way: On the POI interest tab, user can select the check boxes of the desired POIs and click on the Add to report button above the table.
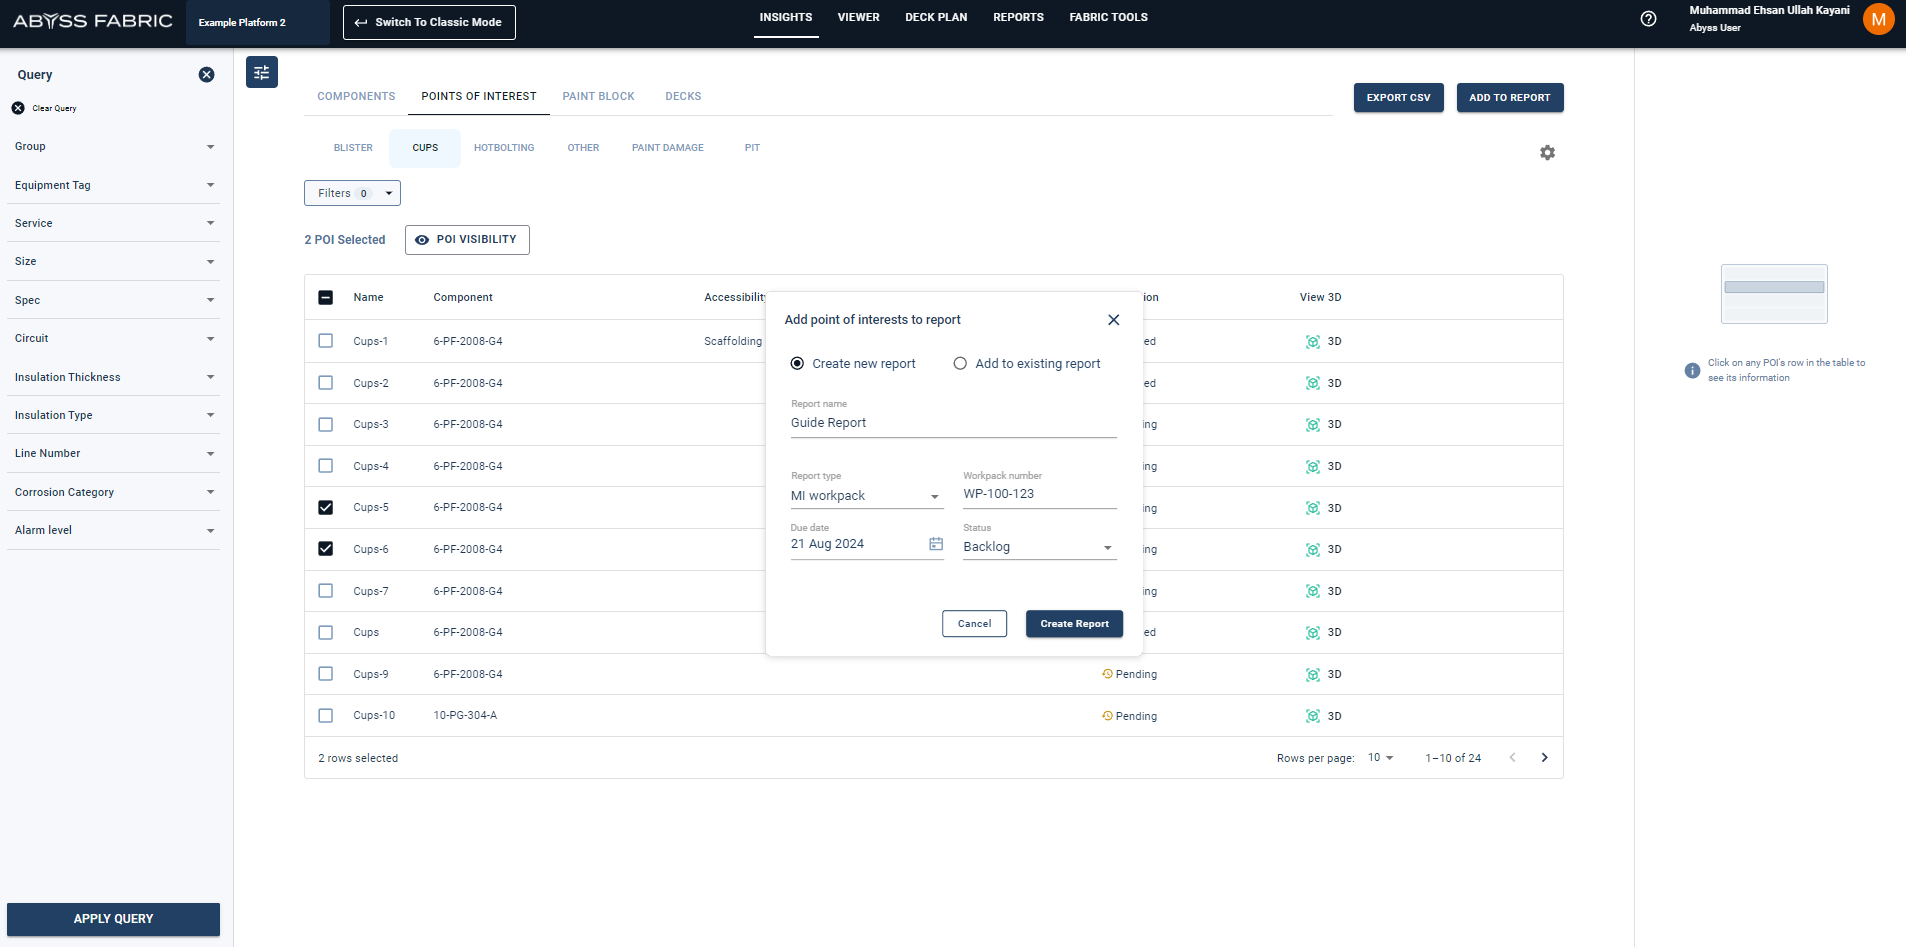
This open up a prompt where the user can set the Report name and other information related to it.
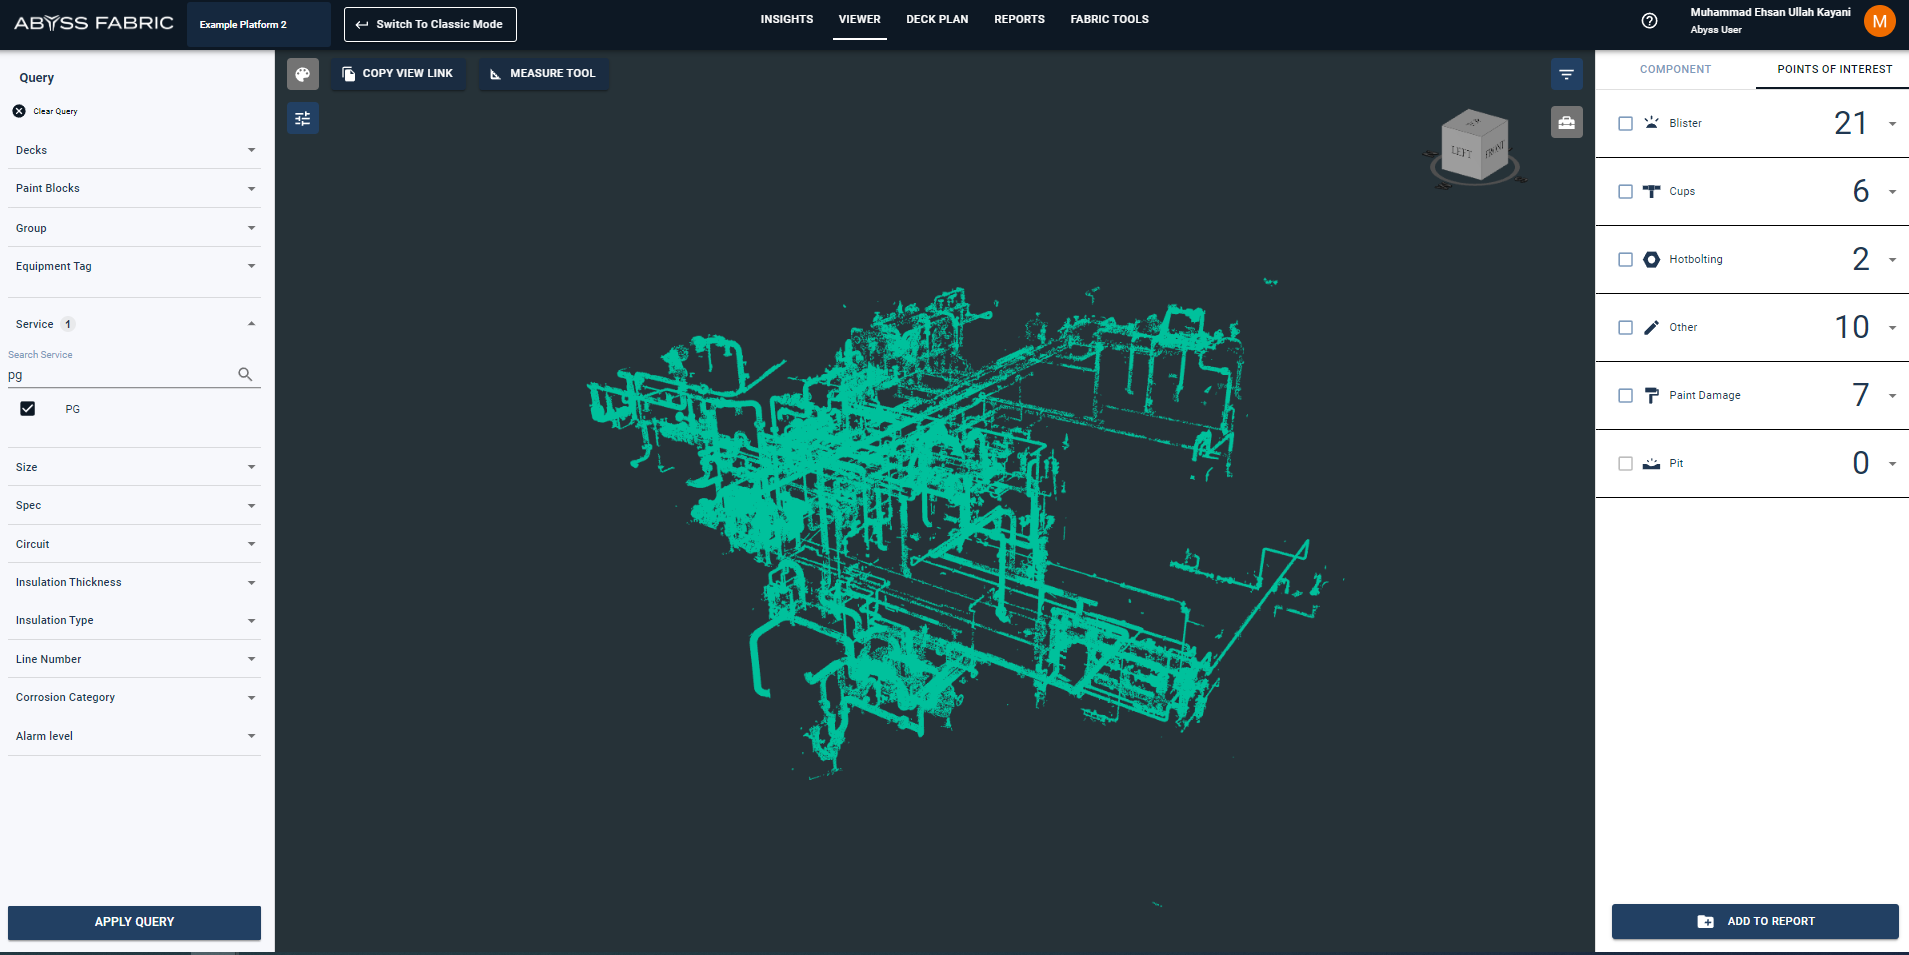
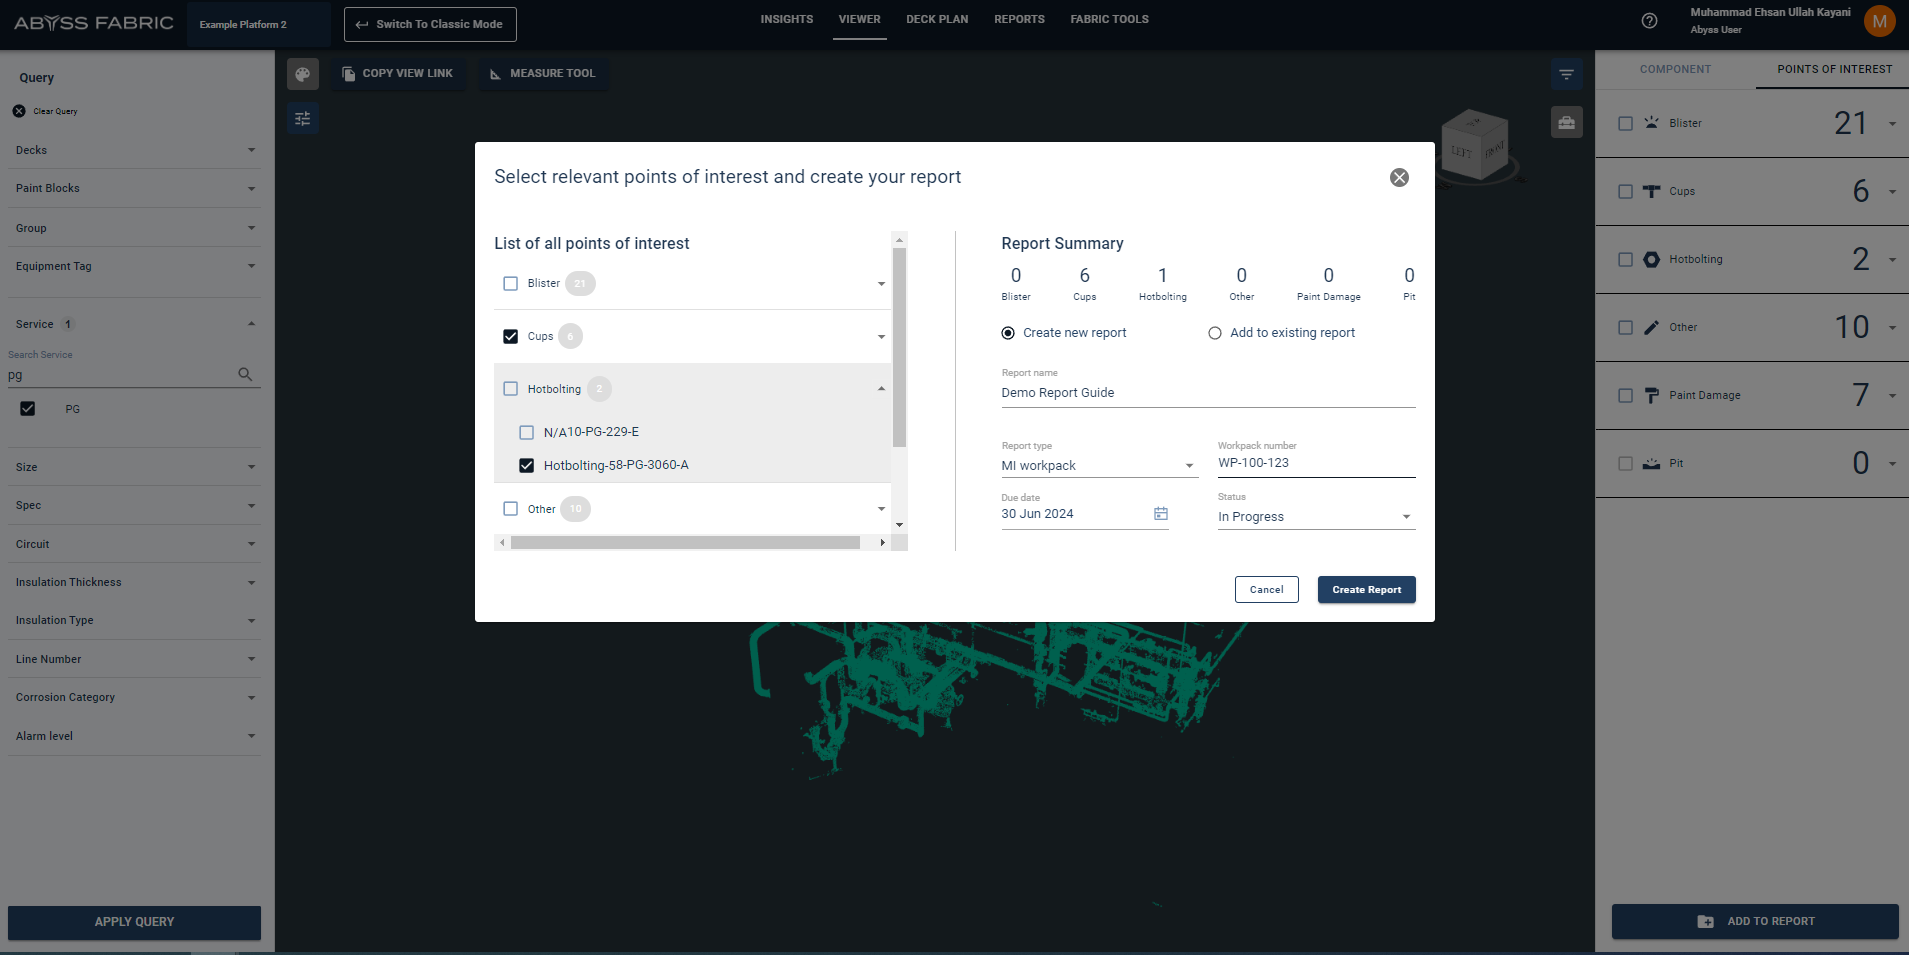
Second Way: On the viewer page, after selecting points of interest tab, user can create a report by clicking on the Add to Report button at the bottom of the tab.
A window opens up where the user can select the desired POIs with check boxes
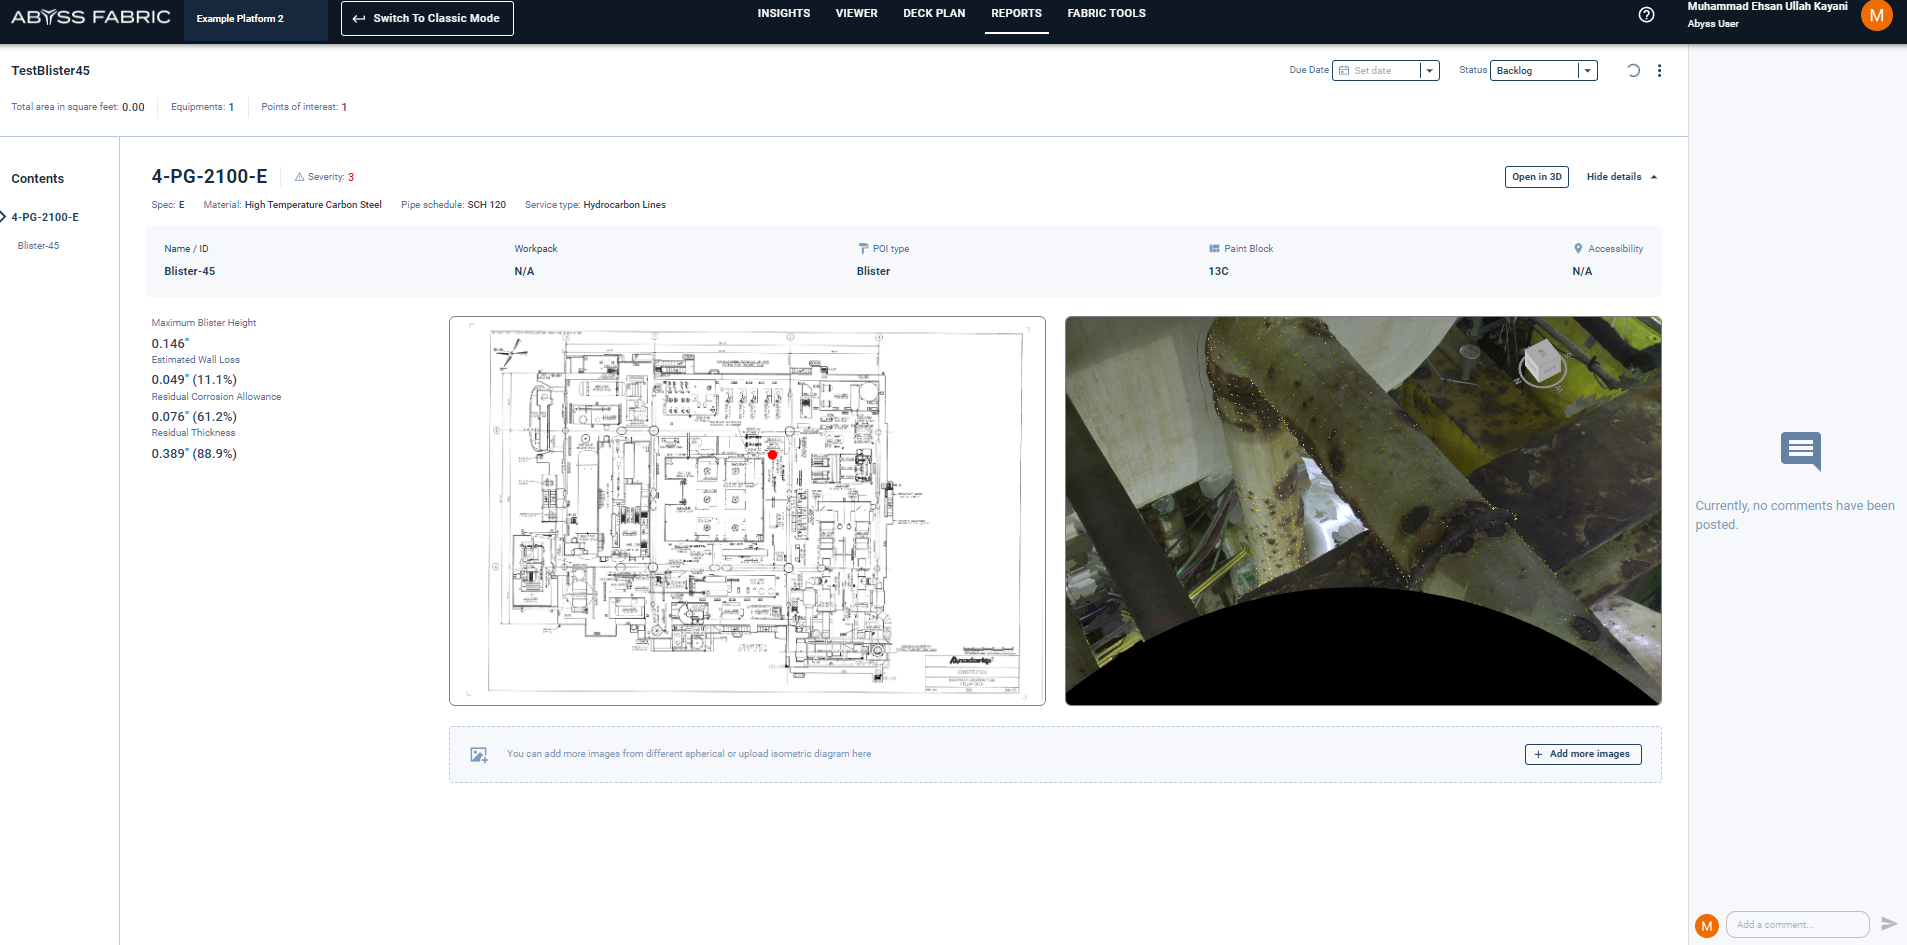
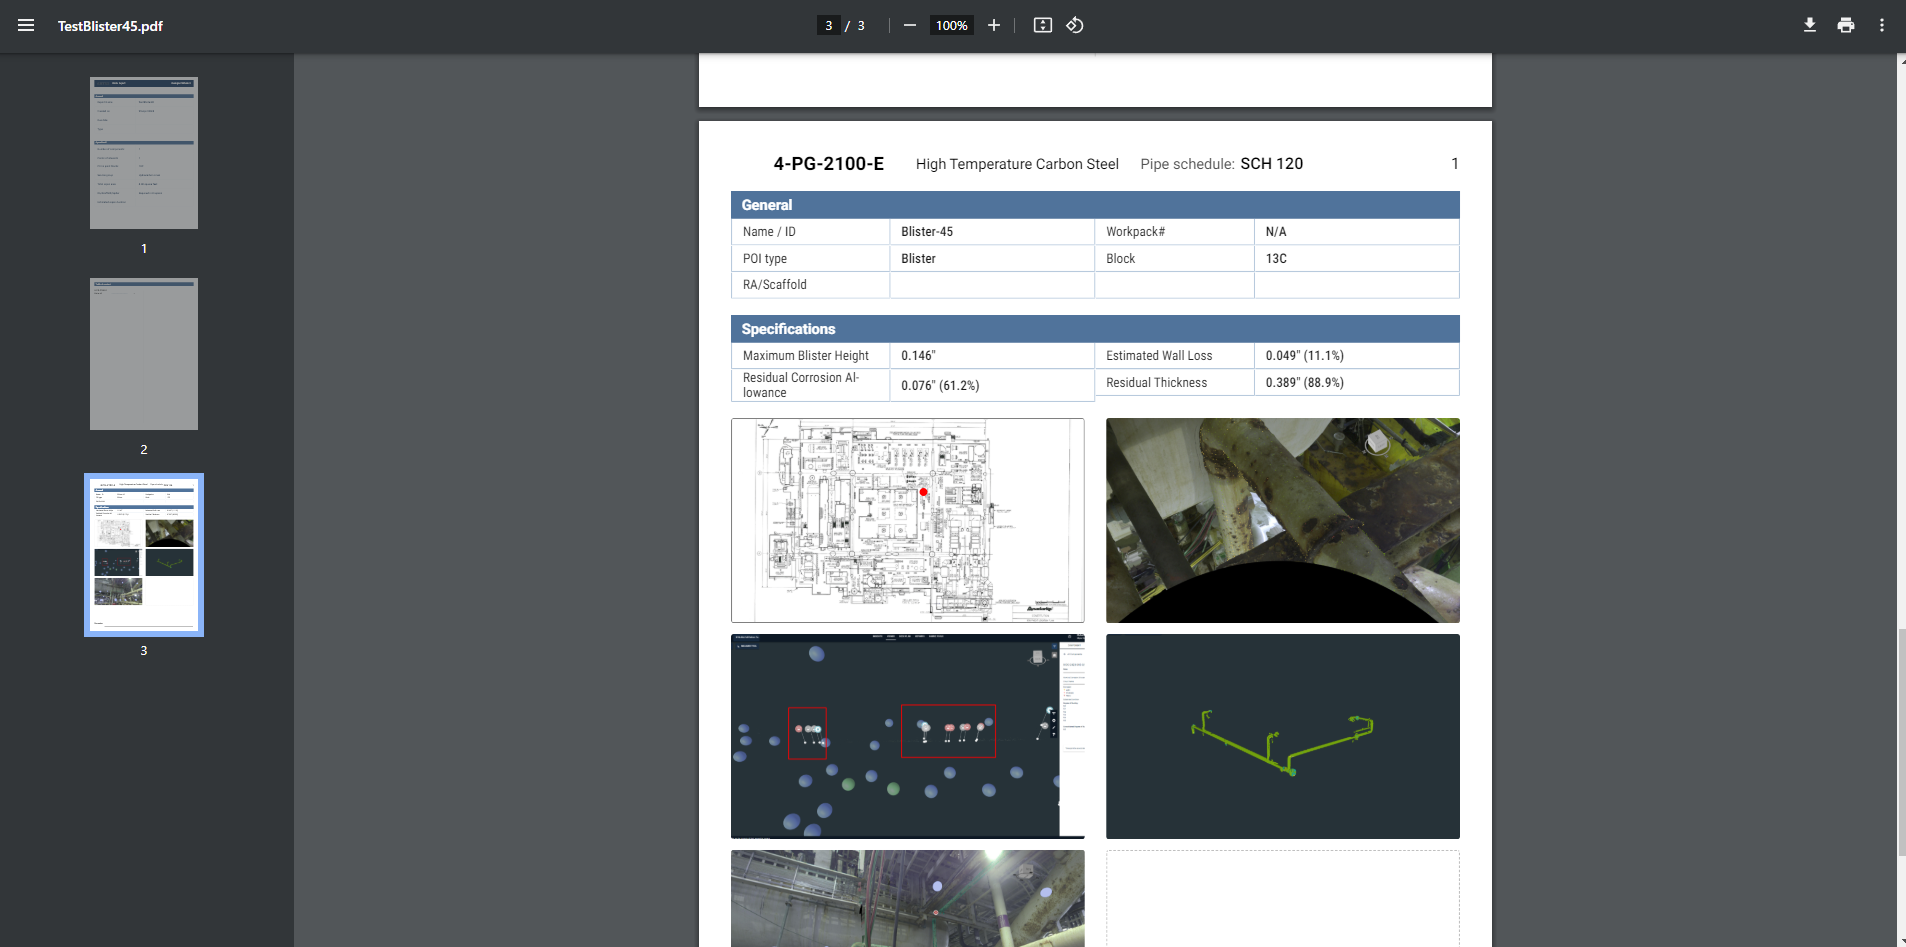
The generated report contains all the relevant information at the asset and POI level. There are 2 auto attached images, one is for the location of POI on deck plan and second corresponds to the image of the actual defect while adding the POI. Users can click on Add more images button to attach further images to the report.
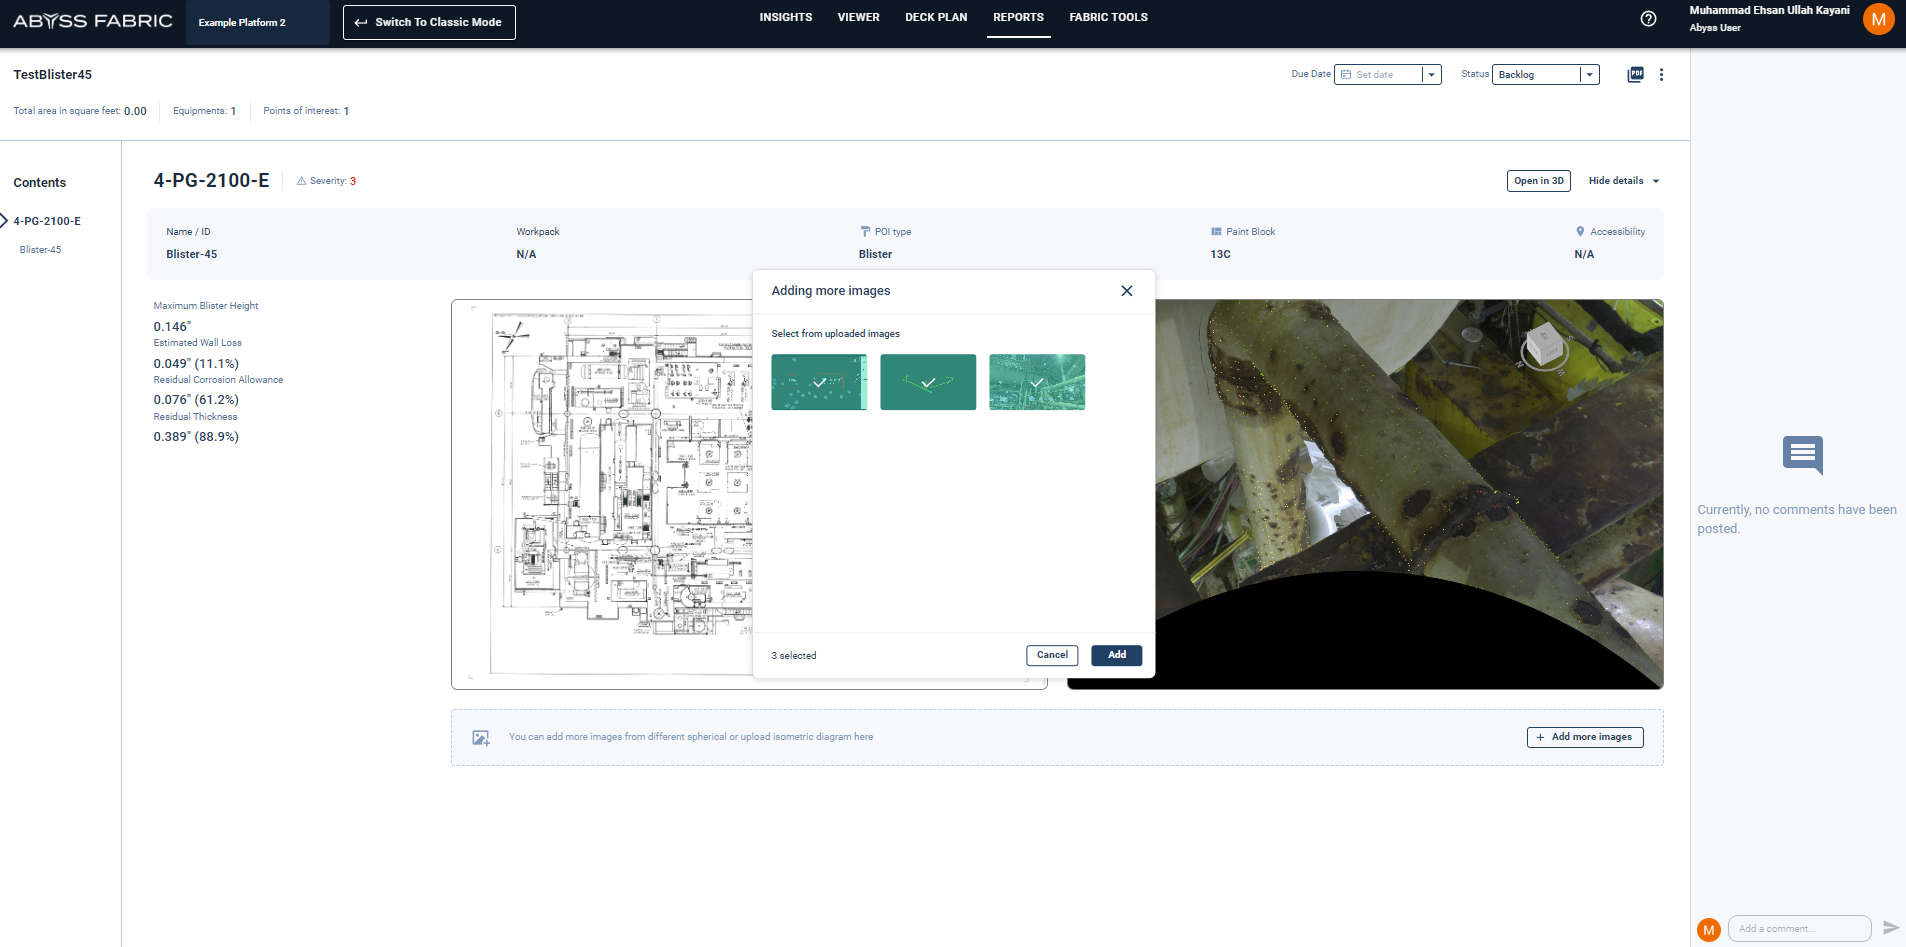
Clicking on the button opens up a prompt window where user can select additional images to be added to the report. Clicking on the add button attached the images to the report.
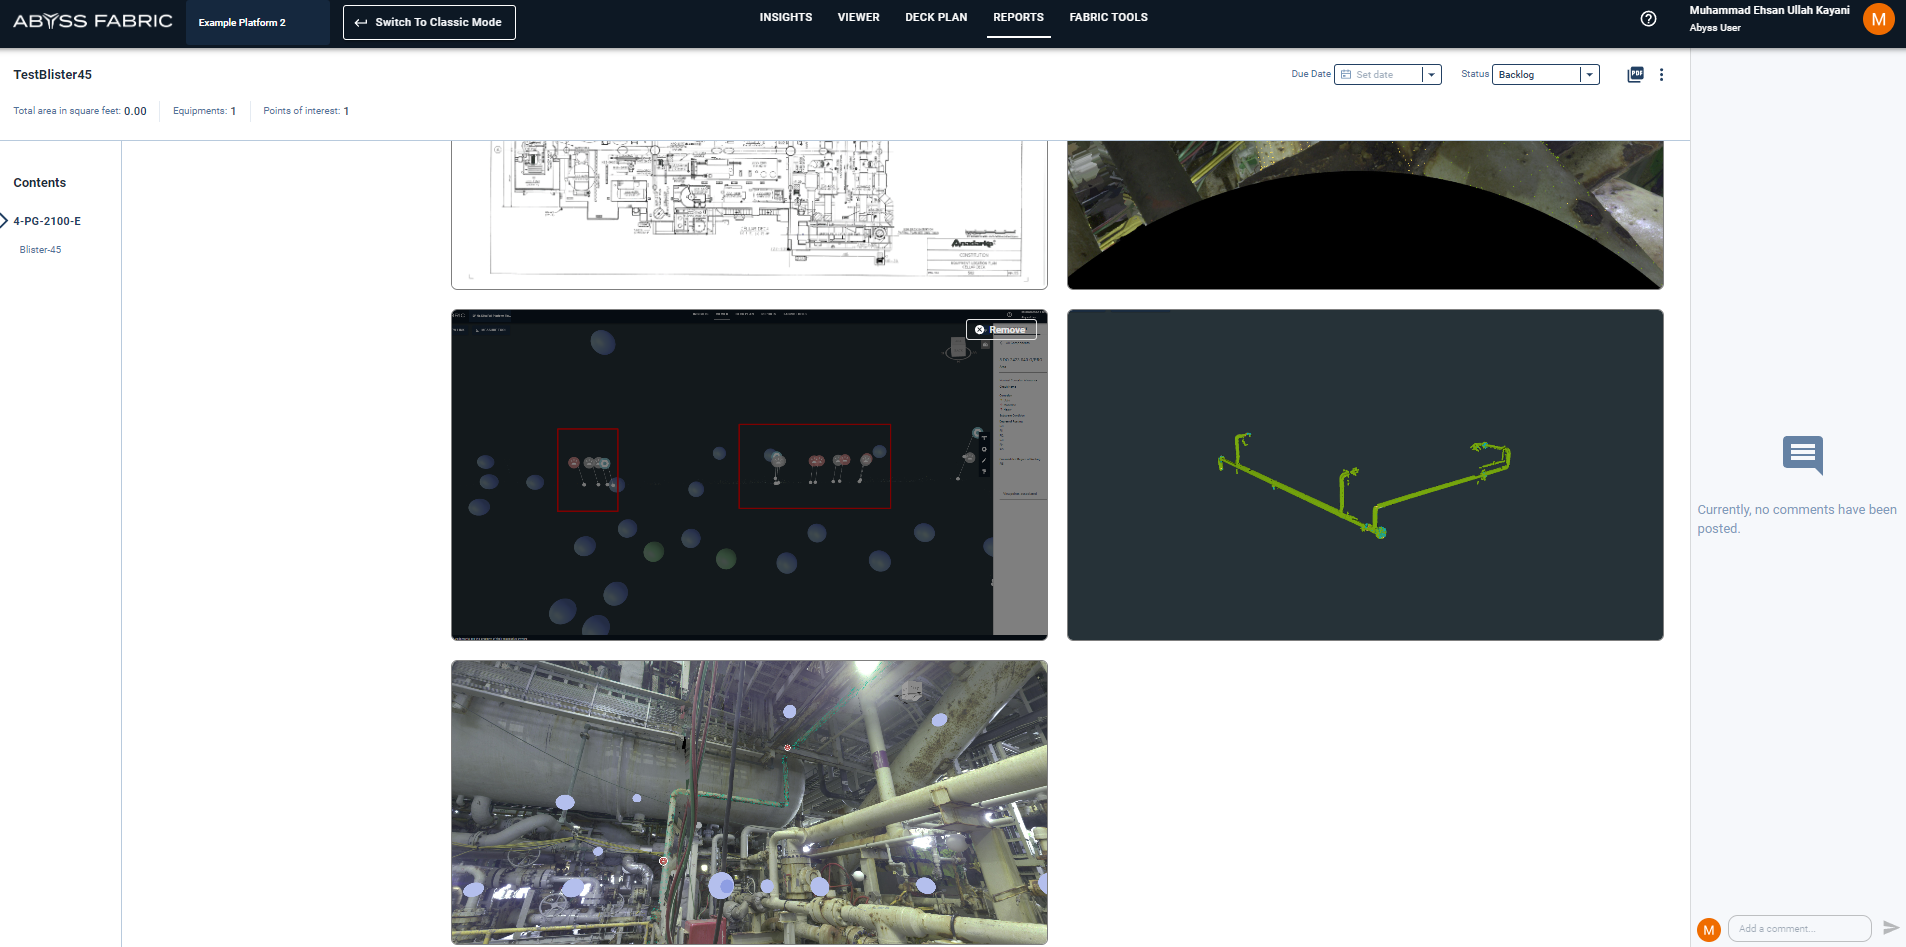
The newly added images can be removed from the report by hovering over the picture and clicking on remove button.
Reports can also be exported as PDFs by pressing the export button. The report format can be seen below. Export report contains all the data and images present in the web report. Exported report also contains executive summary and a table of contents.
Reports now also have a landing page to search and select the desired report
