KPI Tracking
Update: Overwrite Calculated POB Hours
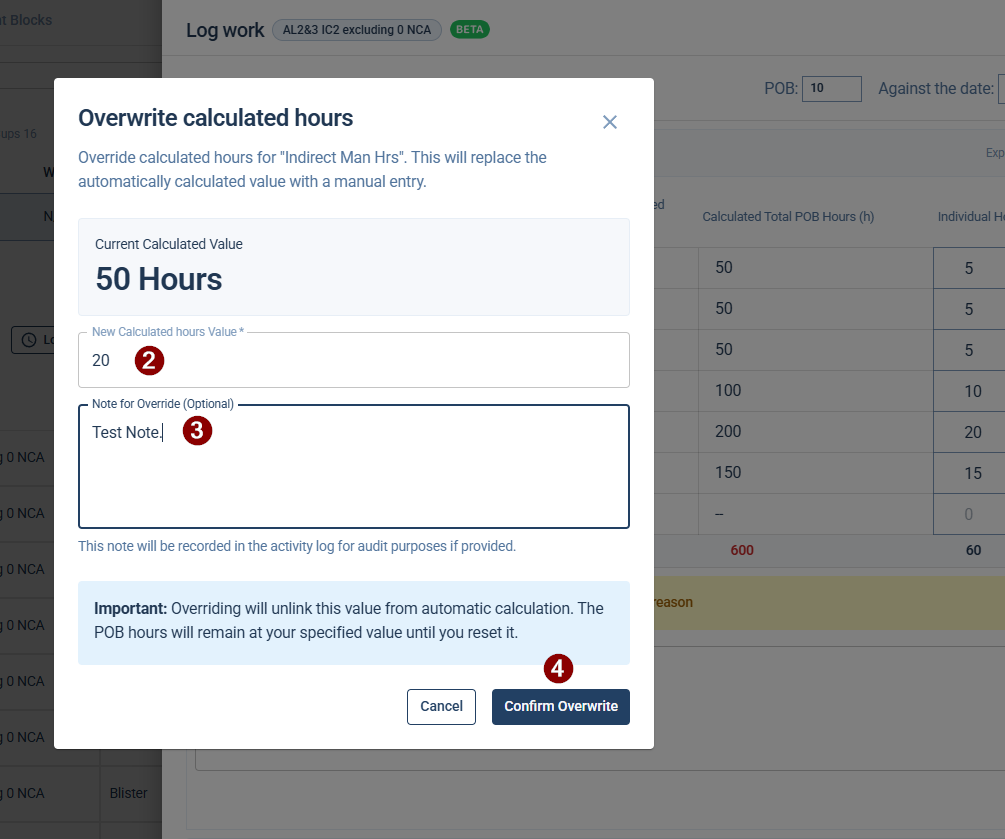
Hover over the calculated total POB hours cell
Click the edit icon to open the overwrite dialog
The dialog displays:
The category name being overridden (e.g., "Tool Time Man Hrs").
Current Calculated Value – the existing system-computed figure shown in large text.
New Calculated hours Value field – where you enter your replacement figure.
Note for Override (Optional) field – a free-text area for documenting the reason.
Enter the new value and an optional note.
Confirm the over write.
Once confirm the overwritten row will appear as:
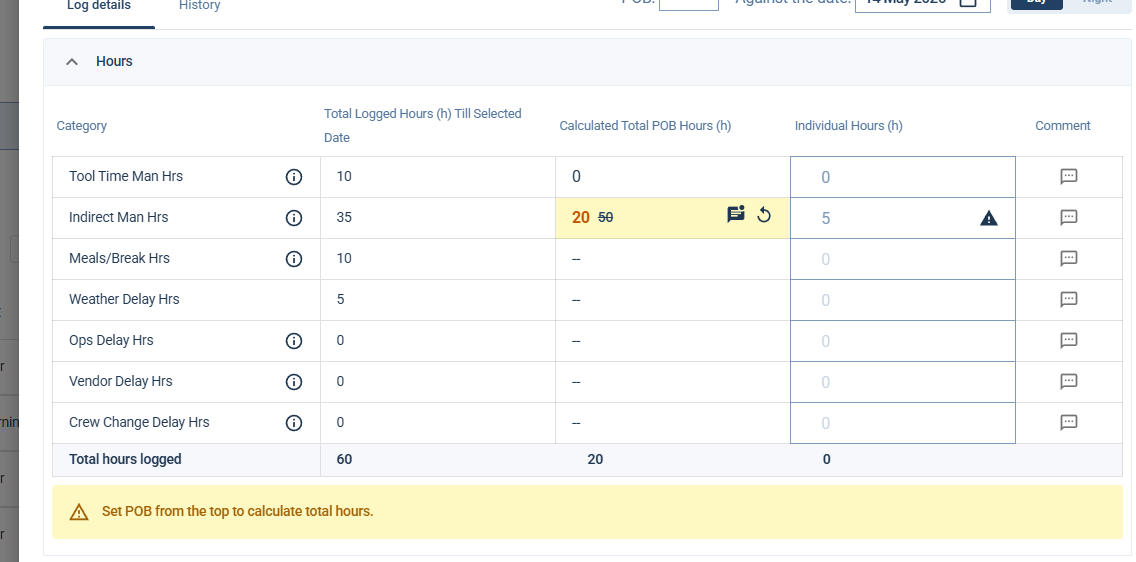
To remove a manual override and restore automatic calculation for a category, click the reset icon.
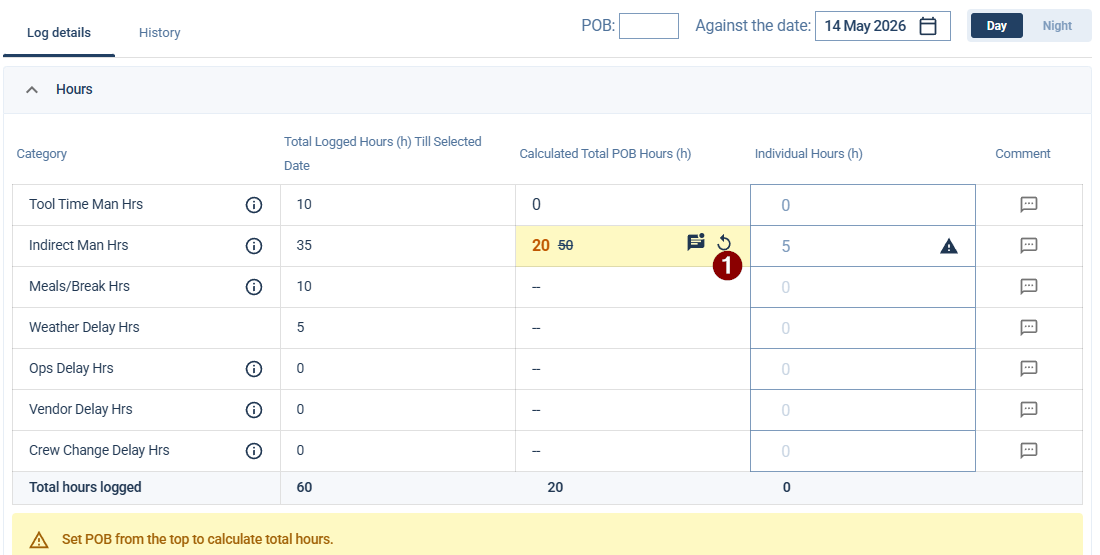
To remove a manual override and restore automatic calculation for a category:
Update: Centralized Logging
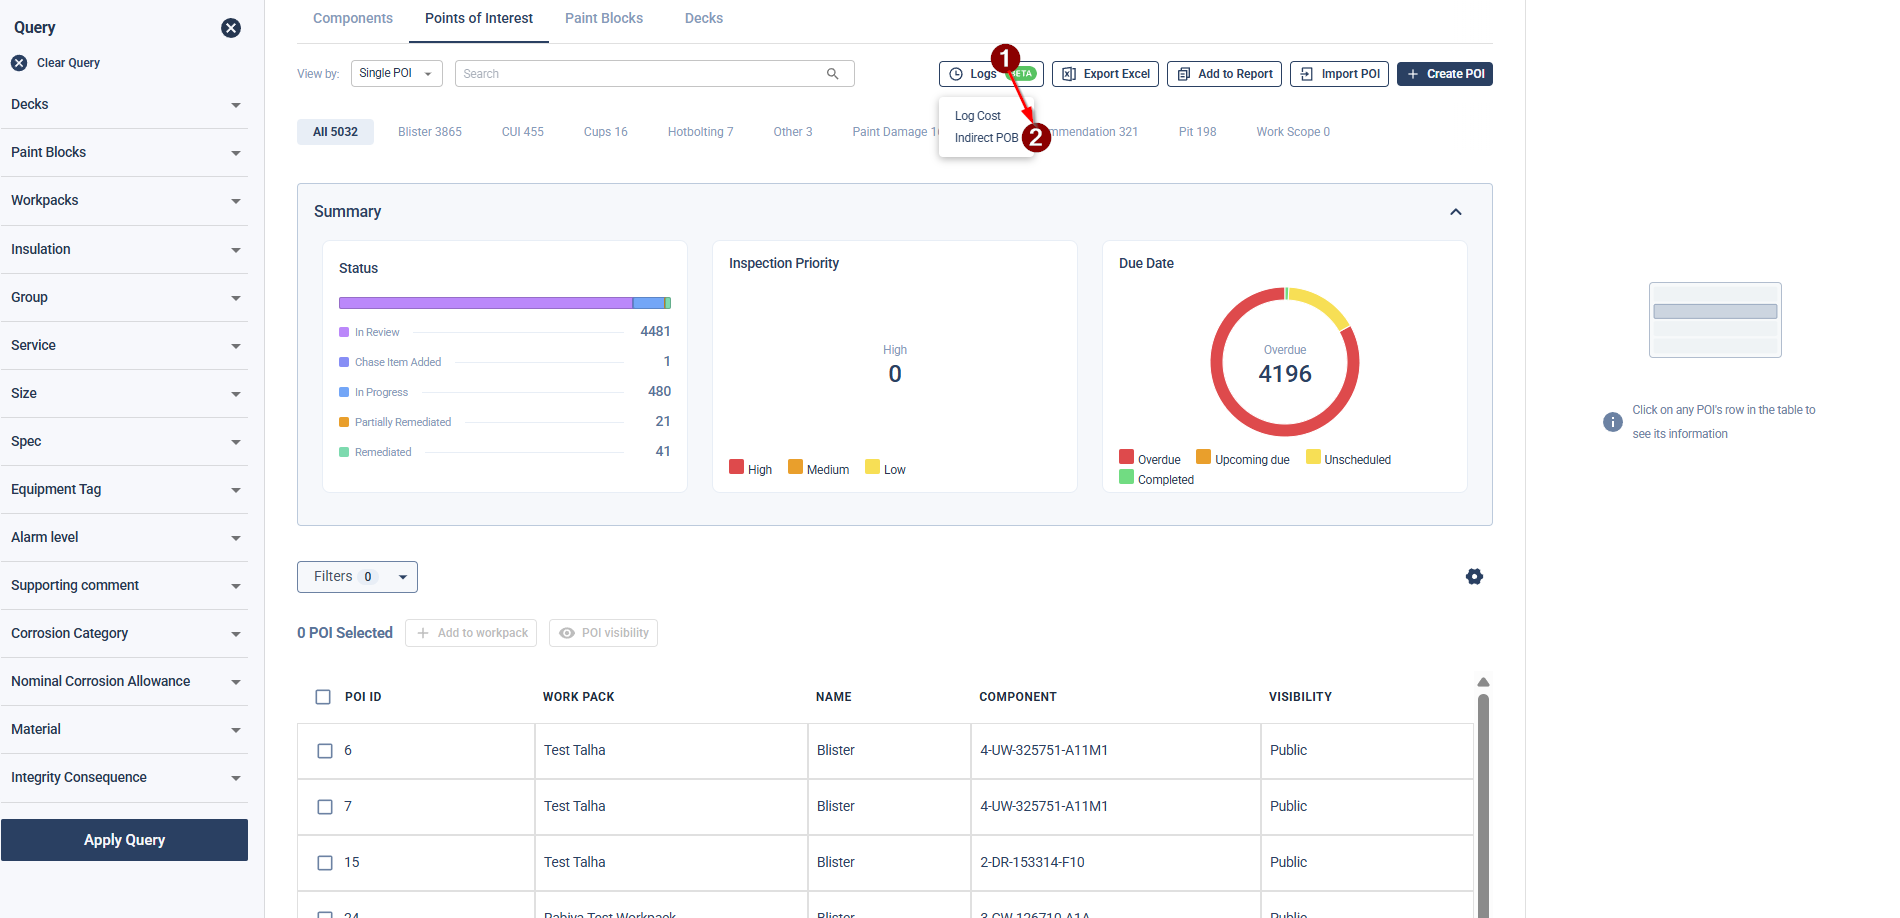
In addition to logging via the Insights tabs, you can now log data directly from the Platform Page for a faster workflow.
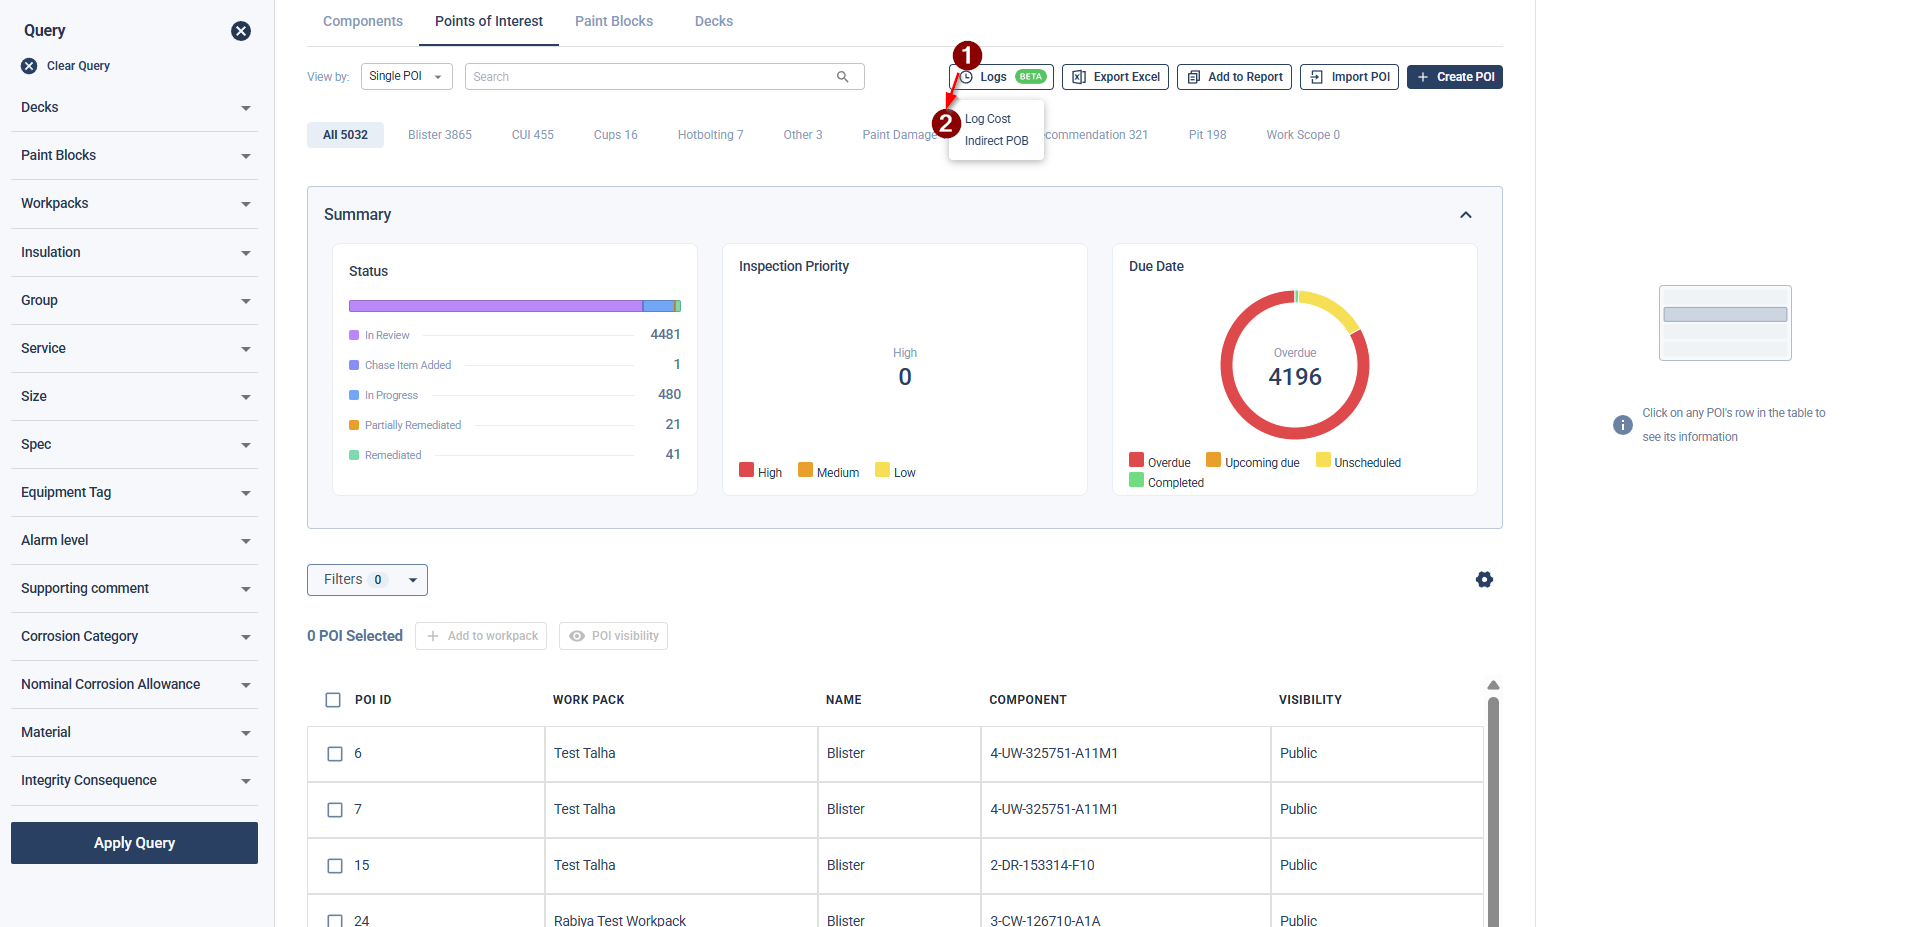
Under the Paint & Crew tab, navigate to the Detailed worklog report table. You will find a new Logs button. This serves as a single entry point for:
Log Work
Log Cost
Indirect POB
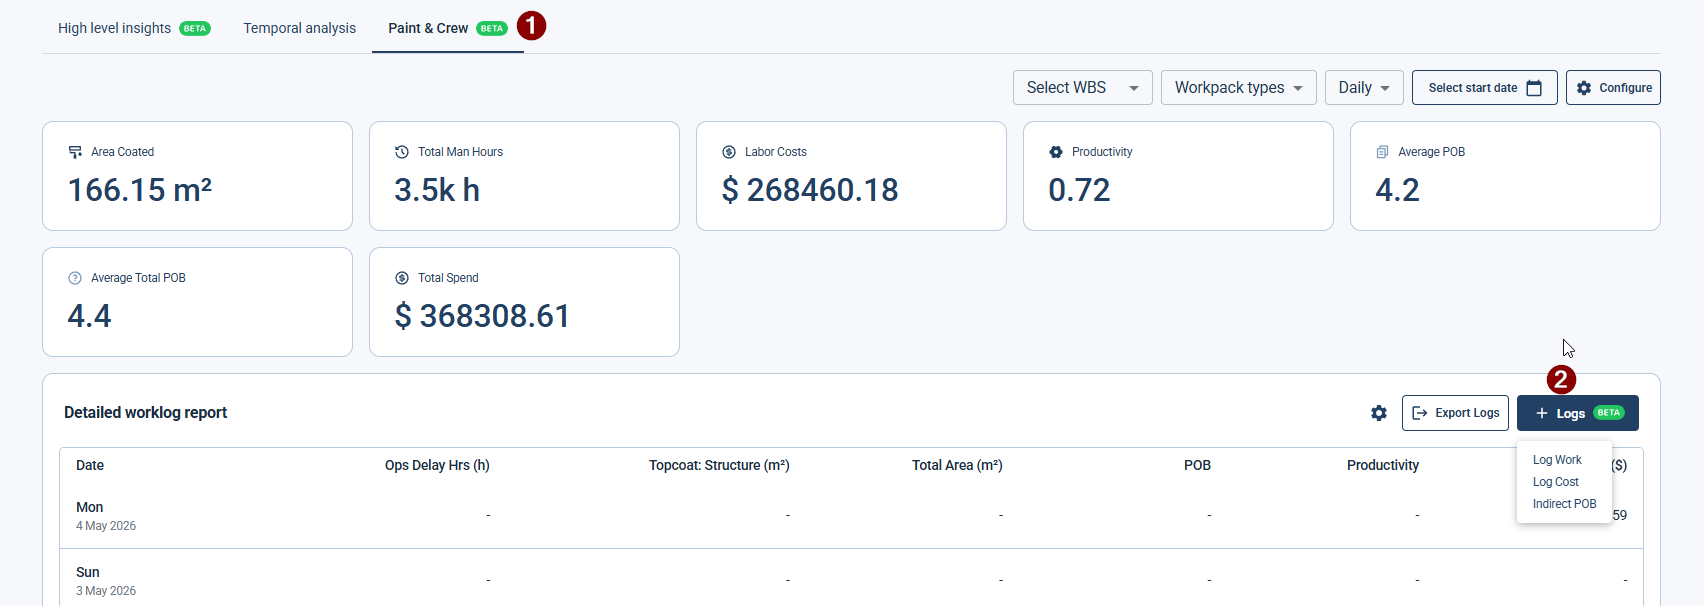
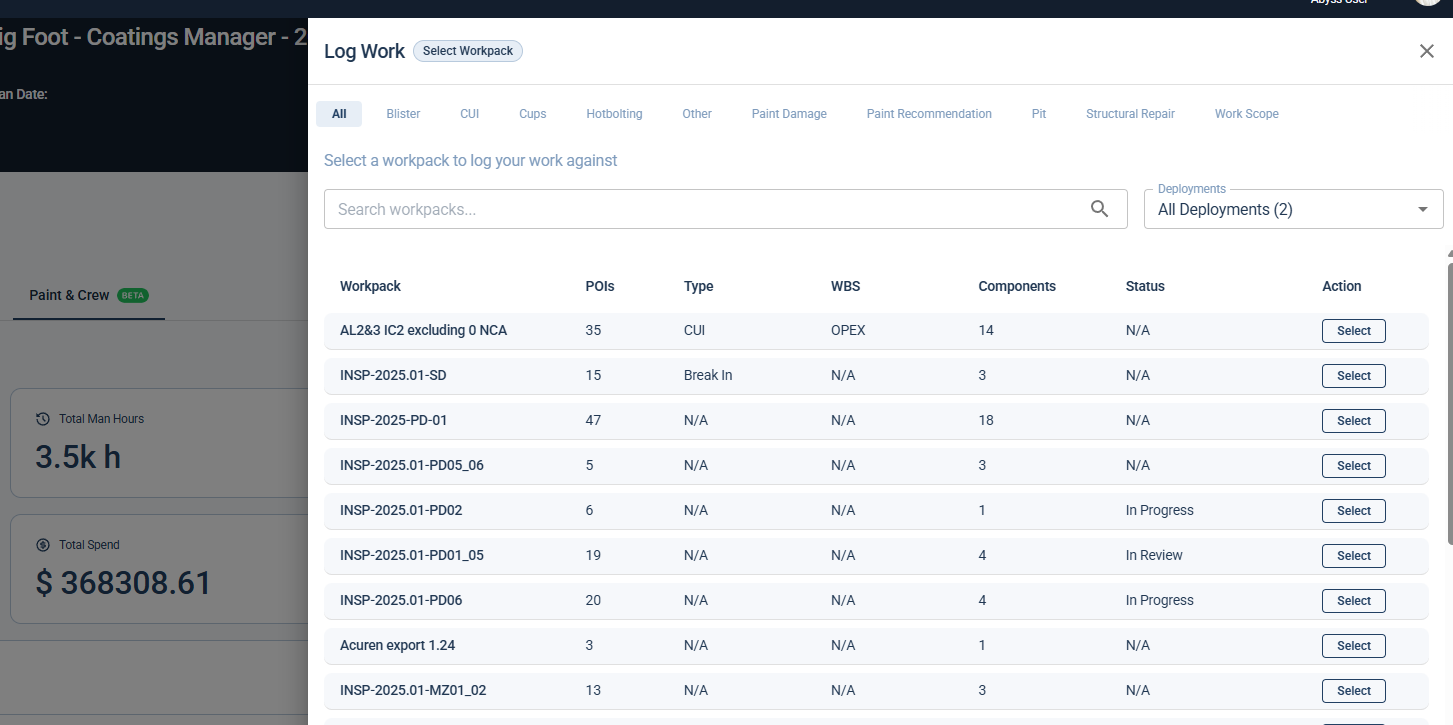
Log Work: This opens a workpack selection screen (see image below). Once you select the specific workpack, it will open the standard log work screen.
Log Cost & Indirect POB: These options open the standard log forms with no changes to the existing workflow.
Part 1: Logging Work Against a Workpack
Navigate to your desired Platform.
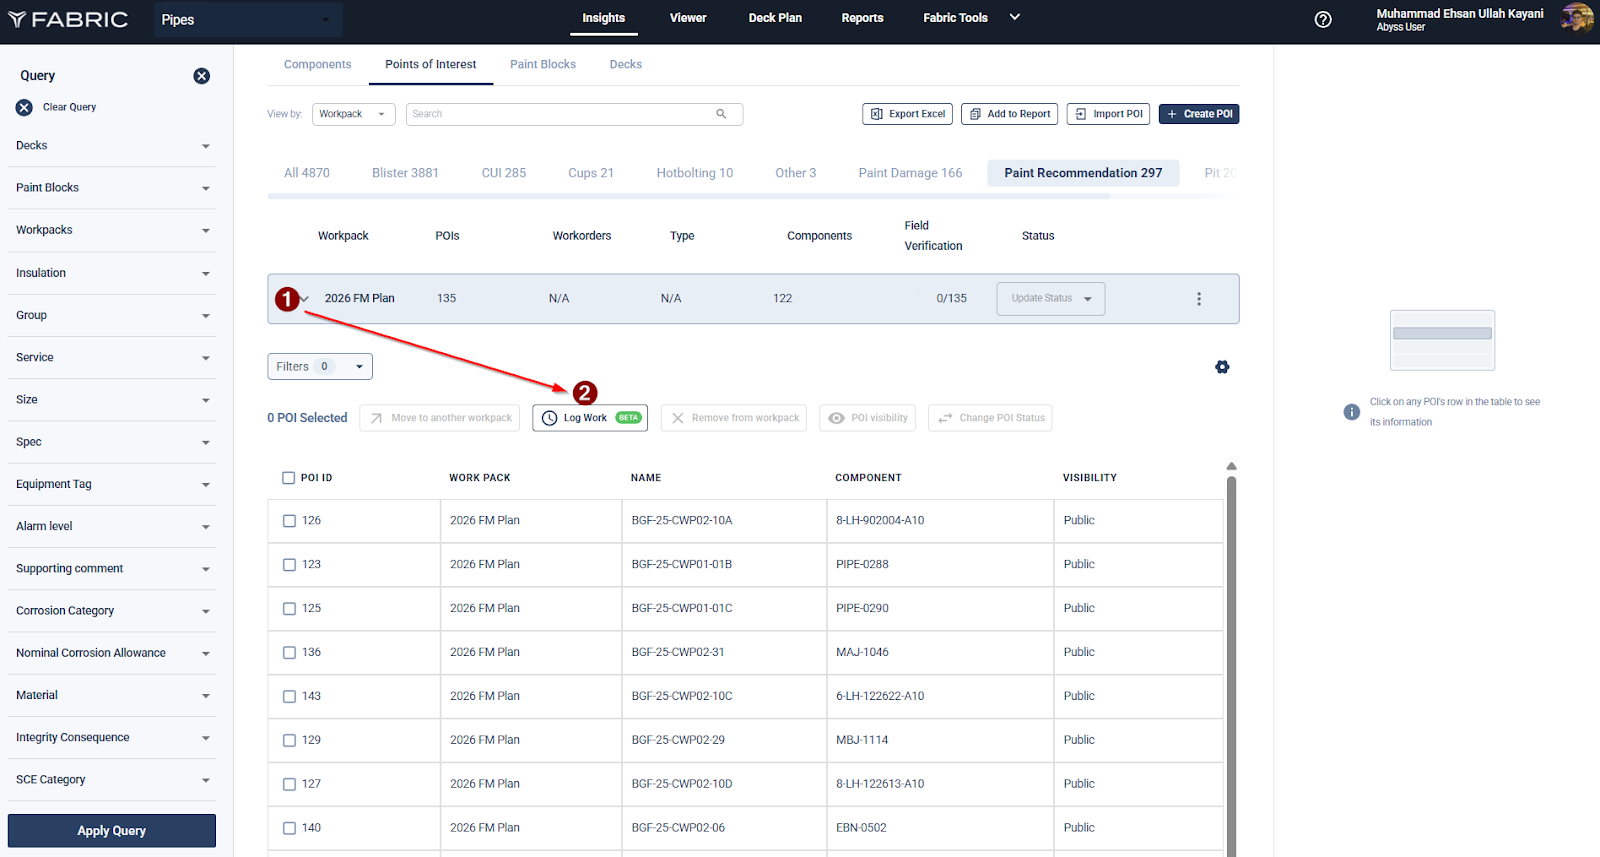
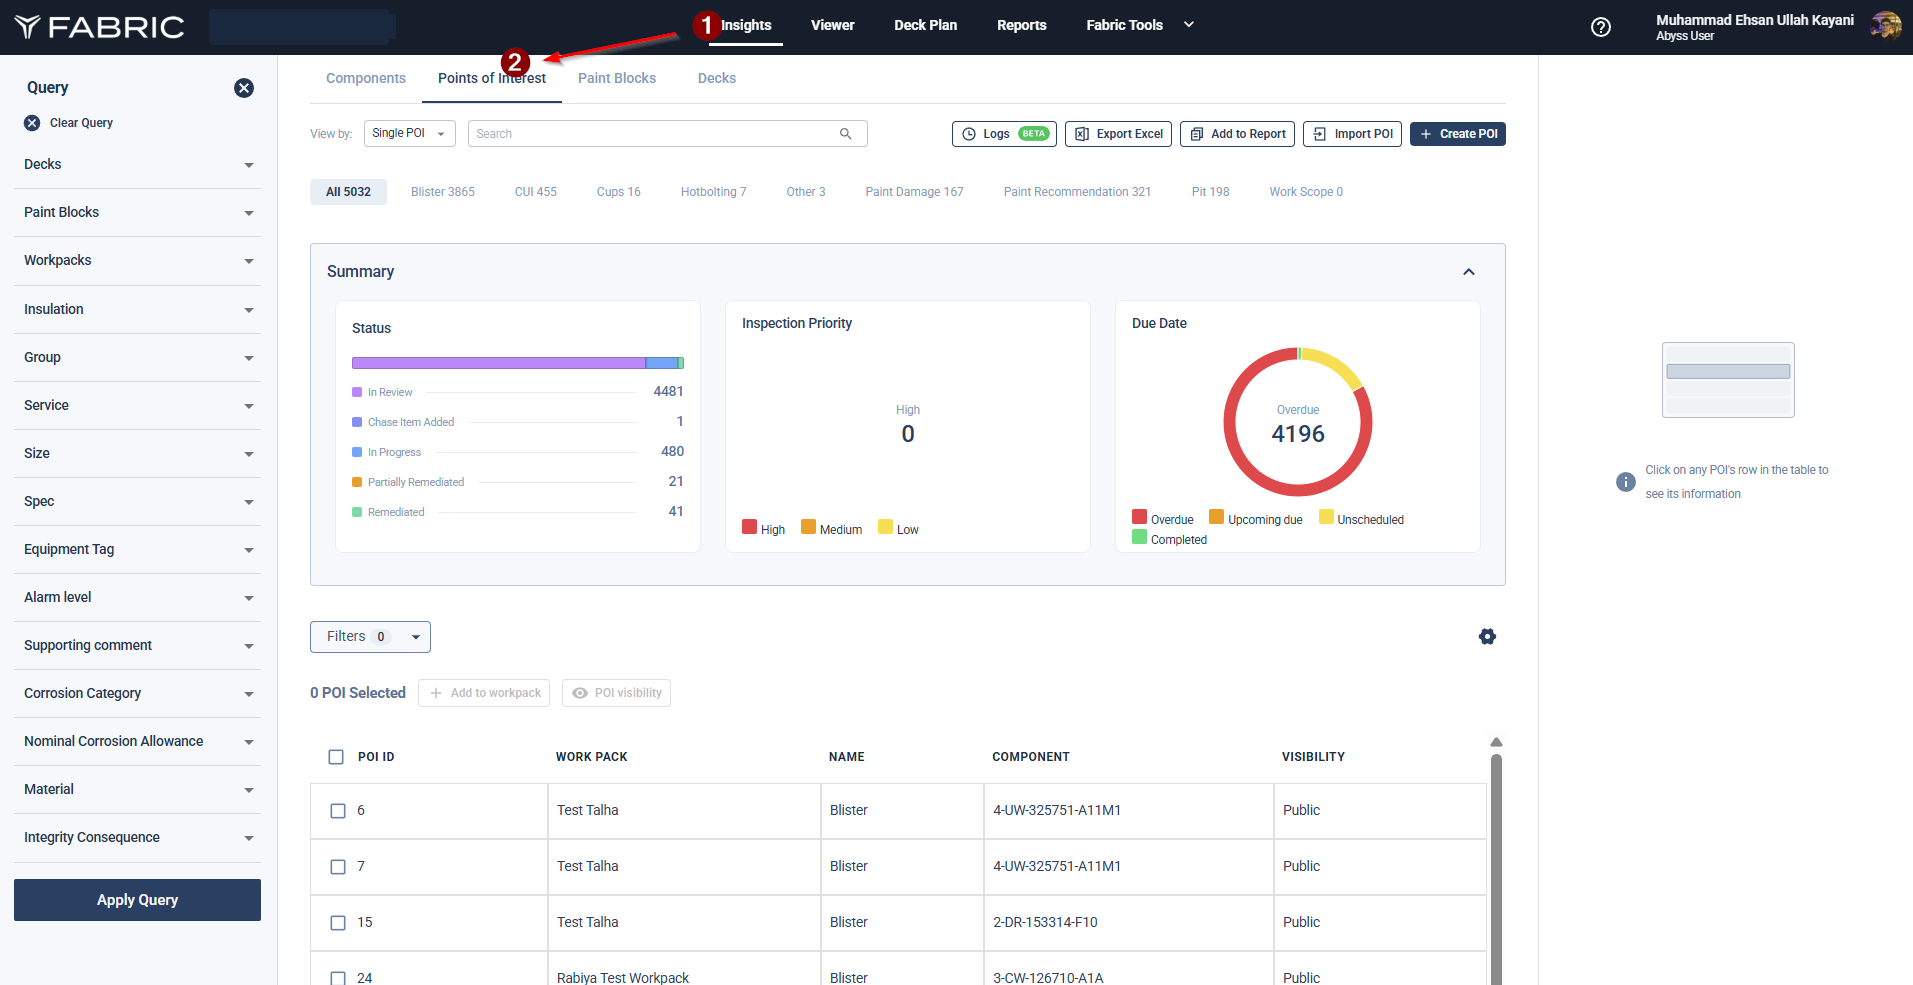
Click on the Insights tab. Select the Points of Interest tab. Choose a Point of Interest (e.g., Paint Recommendation). Change the view from Single POI to Workpack.
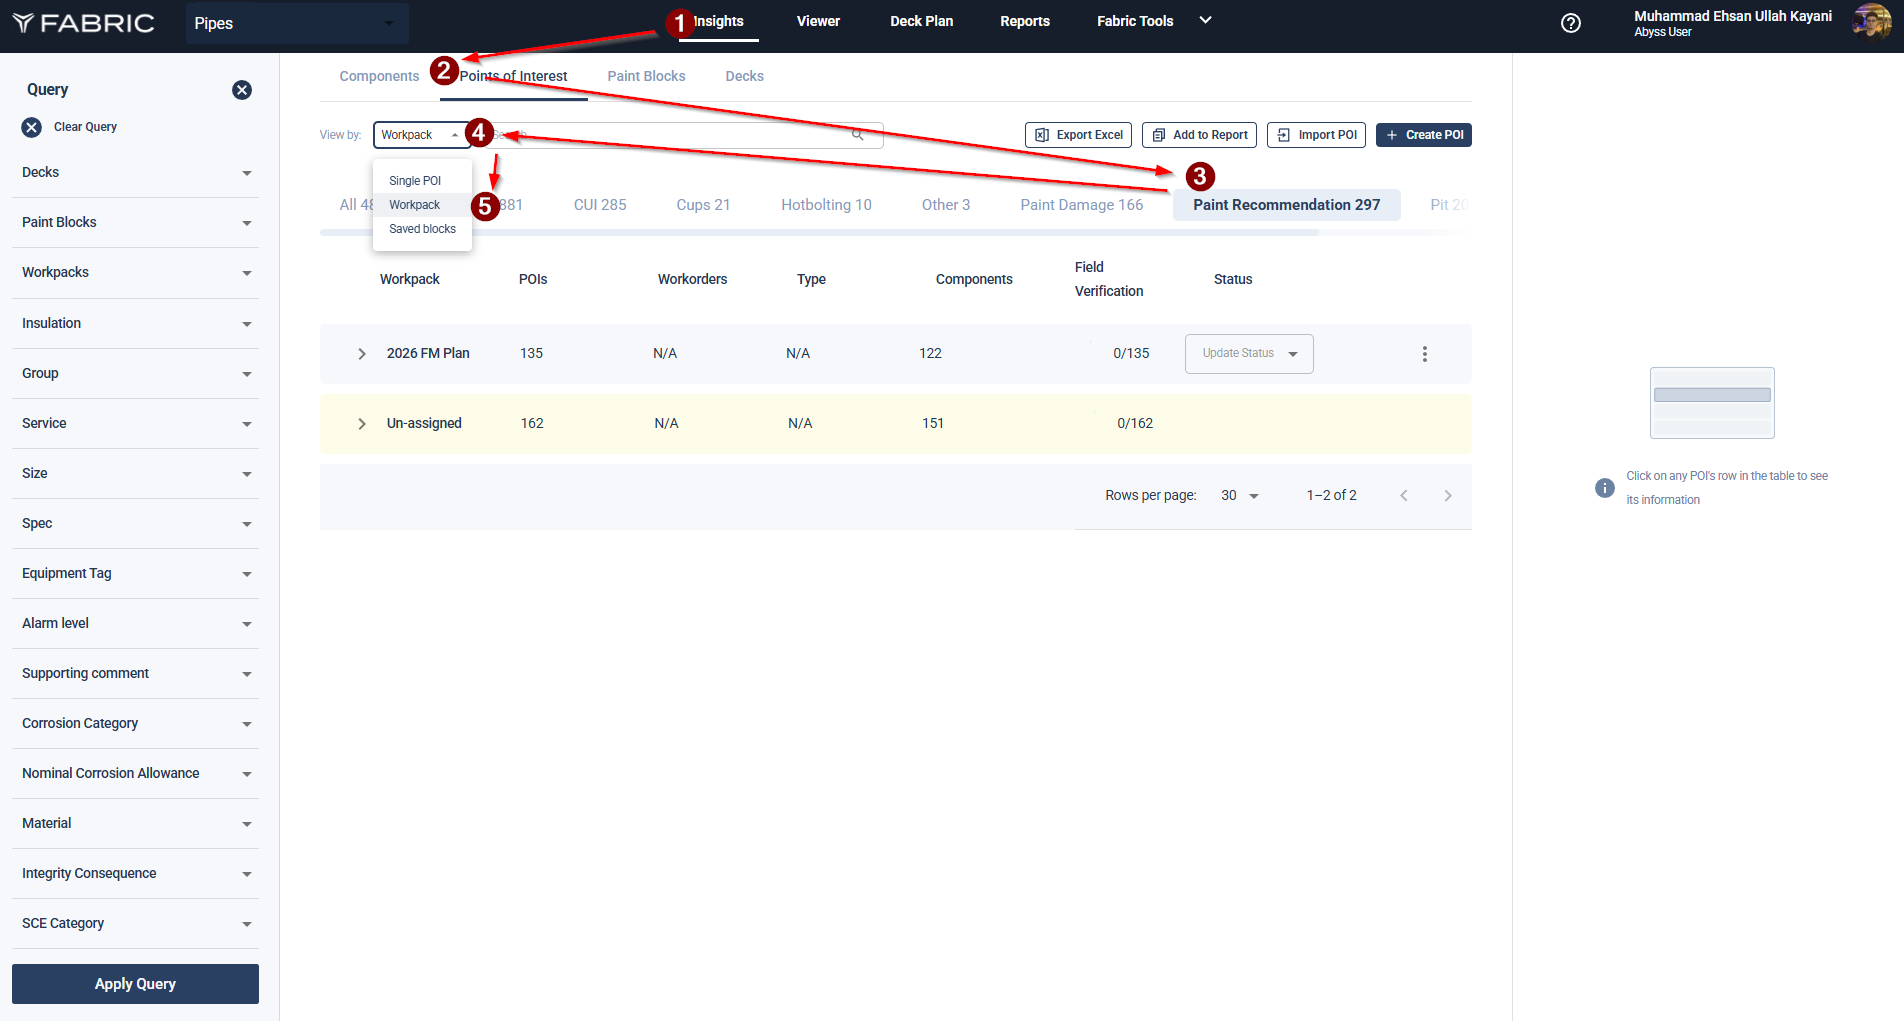
If multiple workpacks are available, select the Workpack you want to log hours against. Click on Log Work.
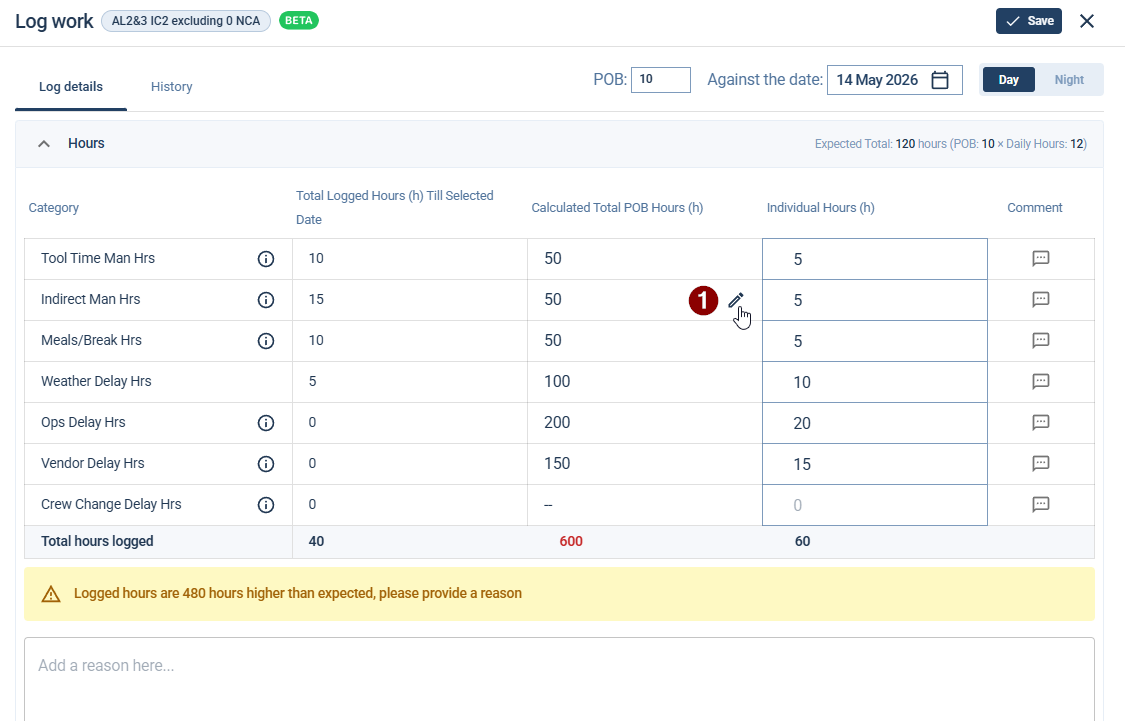
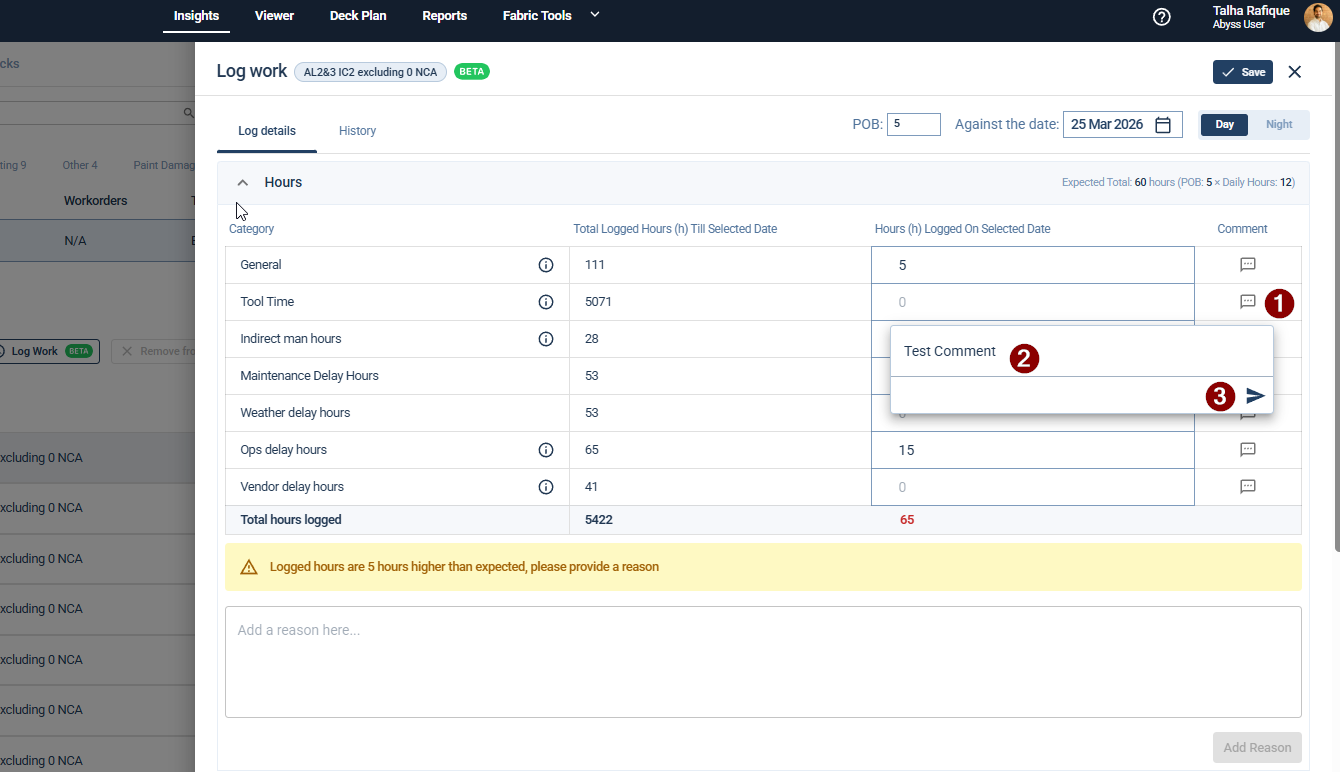
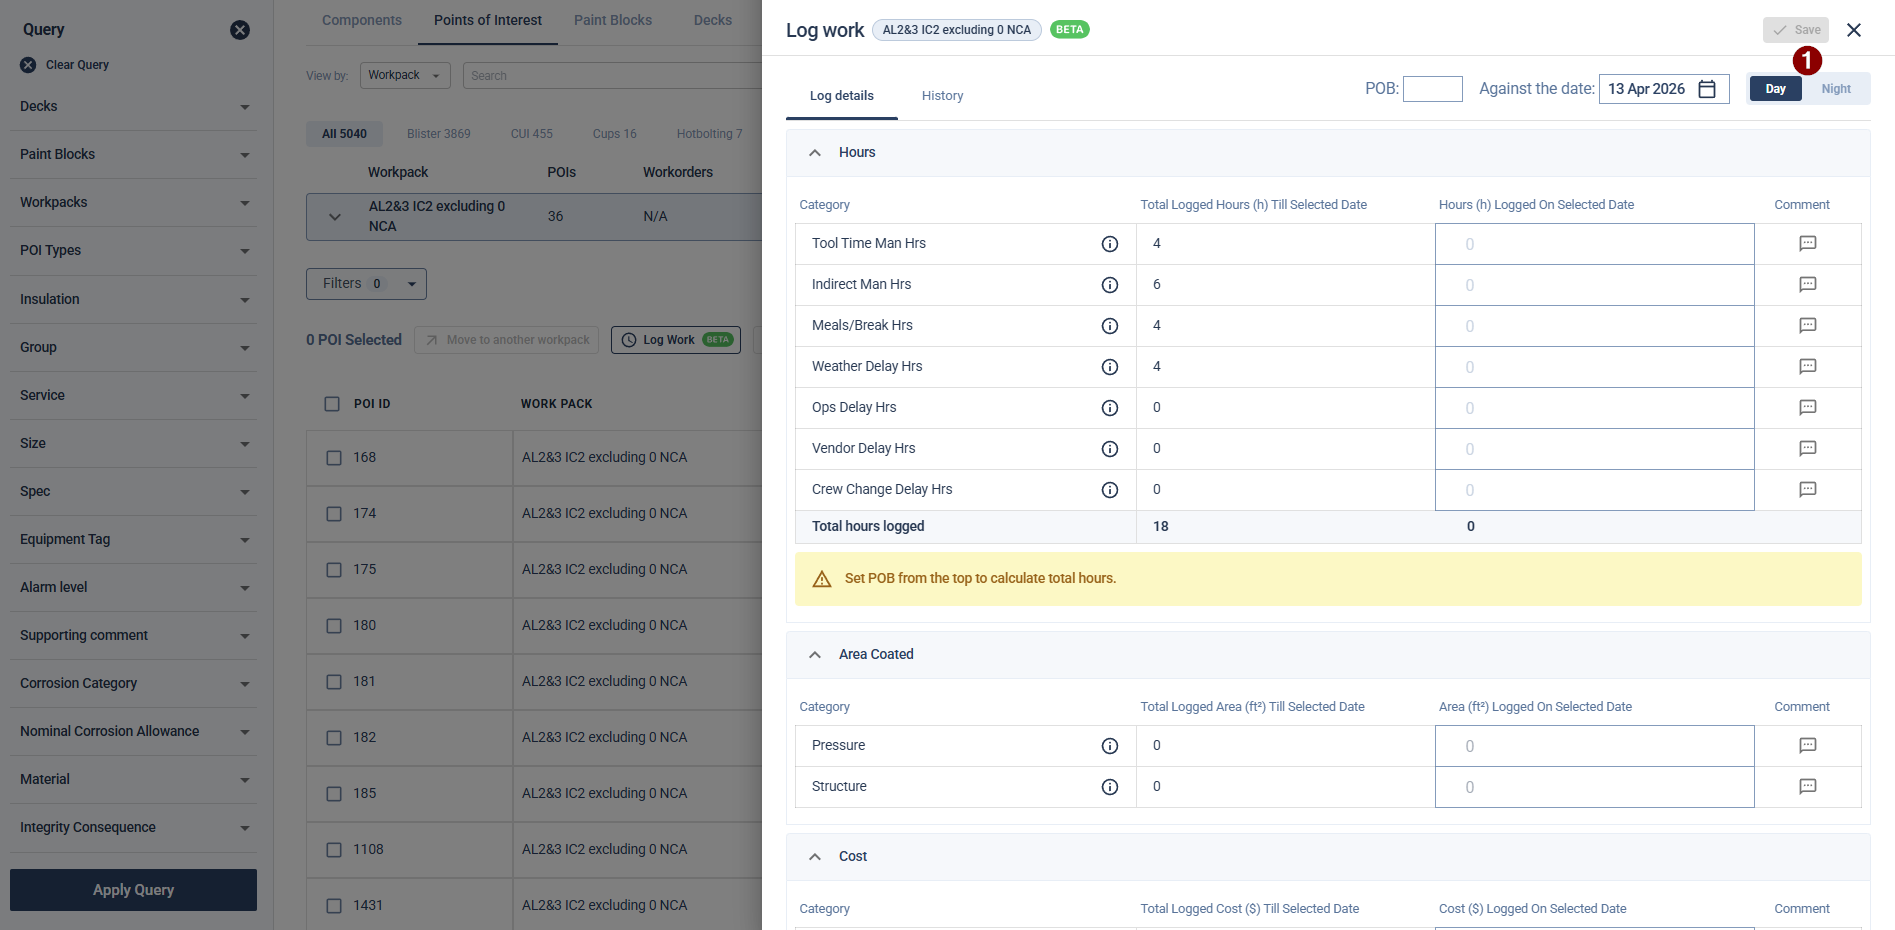
Use the Calendar Icon to select the date for which you want to log data. After selecting data select the Day or Night shift.
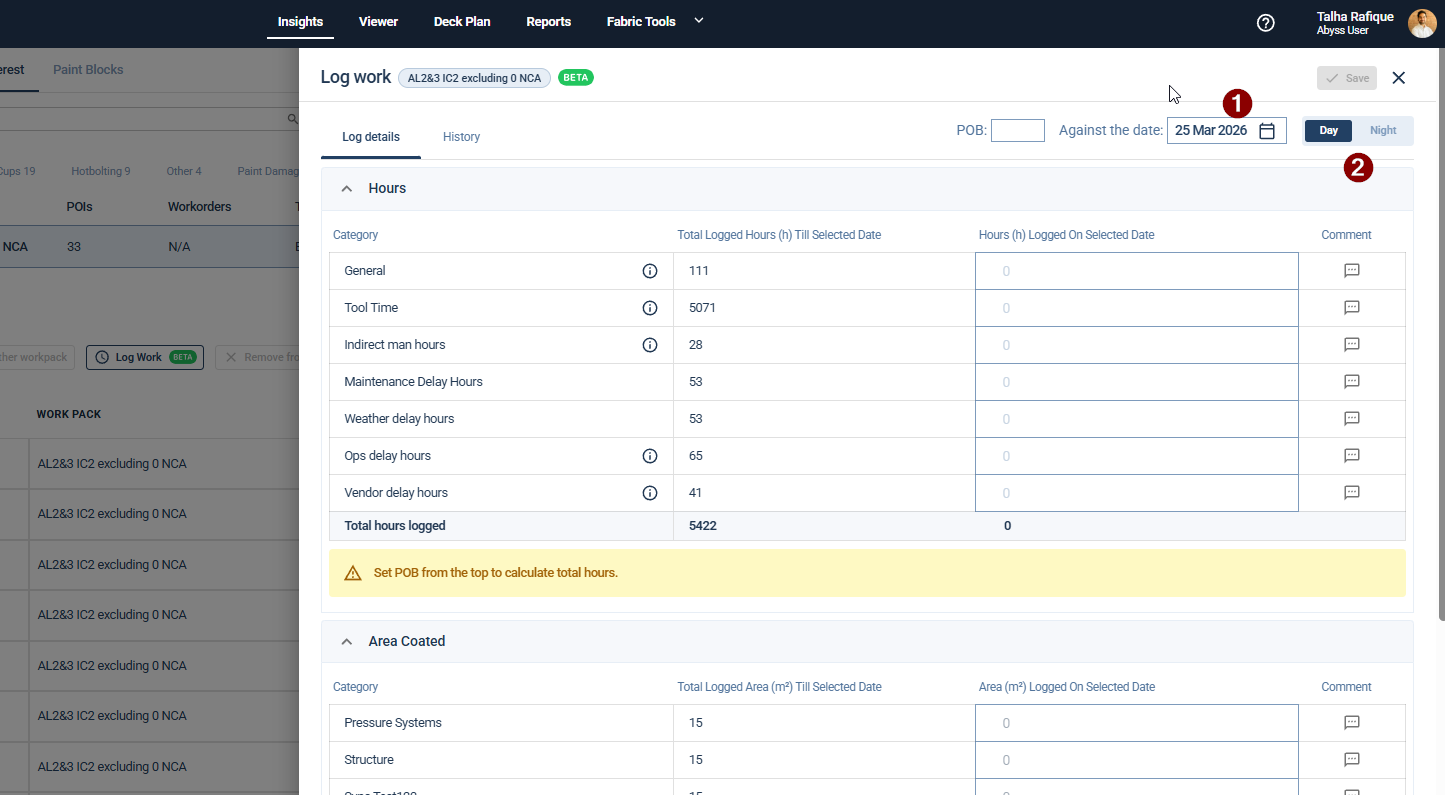
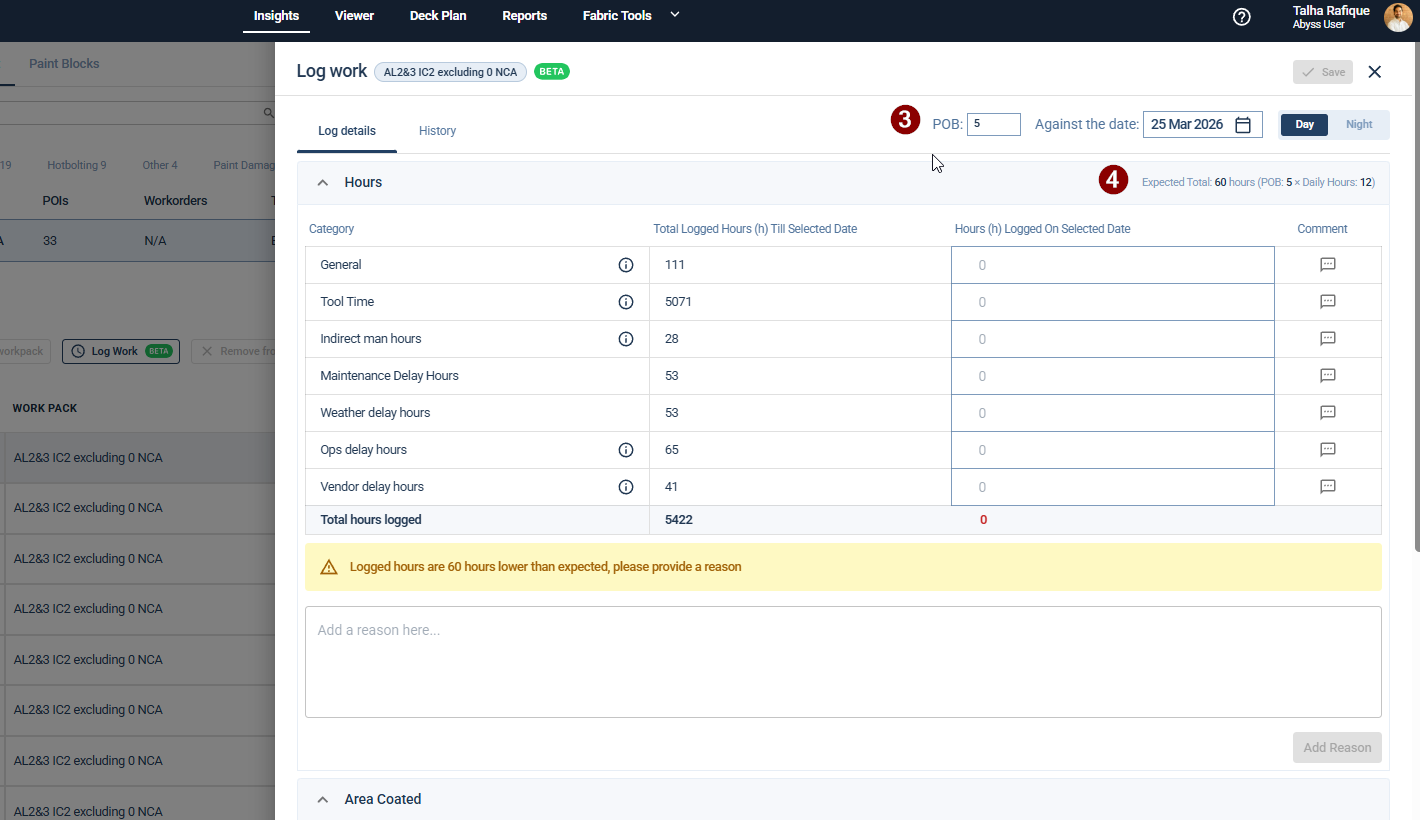
Once a date is selected, enter the POB (Persons on Board) for that specific day. The system will automatically calculate the Expected Total hours based on the number of POB entered.
For the selected date, you can:
Edit previously logged data, or
Add new data.
The system will track the Total logged hours. If there is a discrepancy between the logged hours and the expected hours, you can provide a reason in the discrepancy reason field.
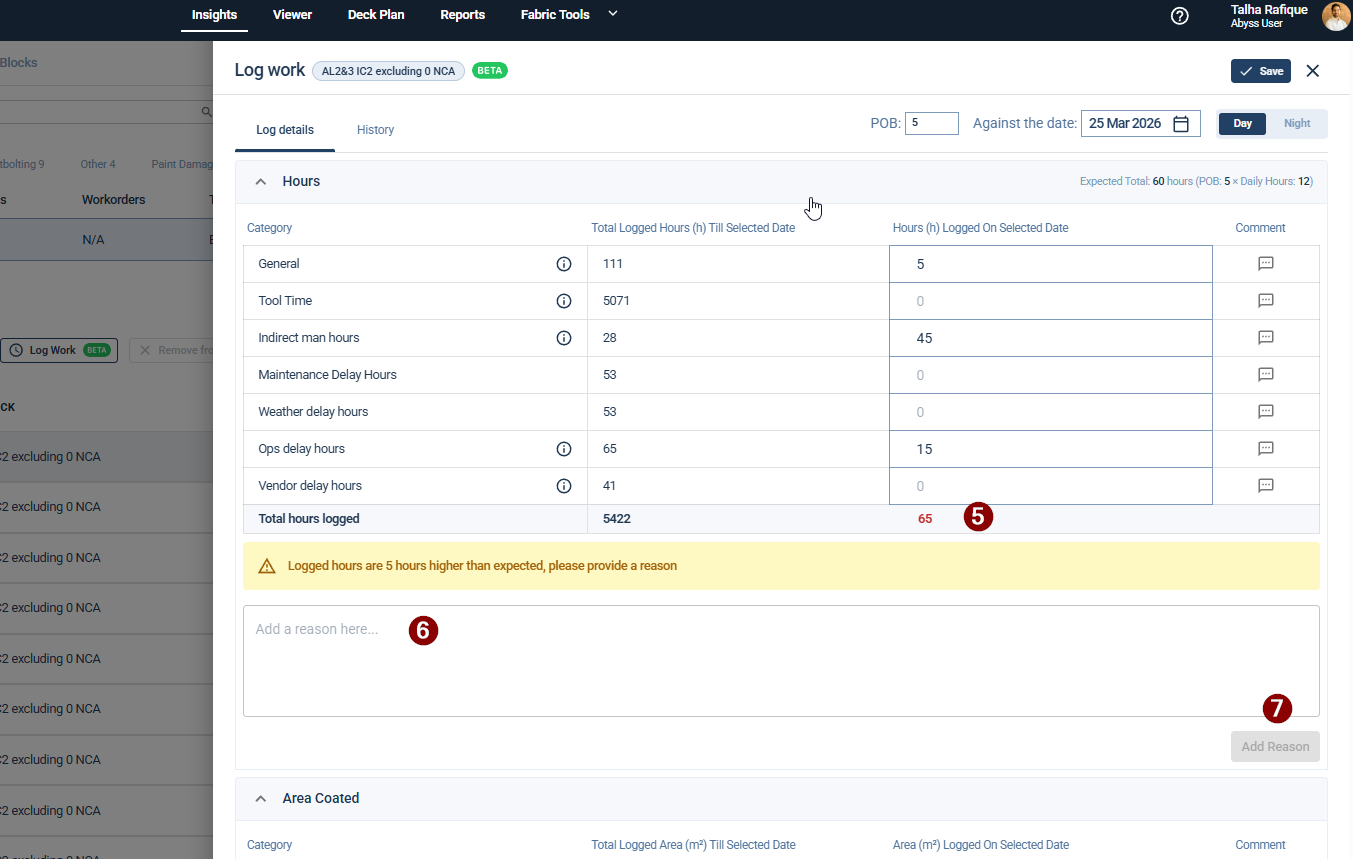
Add specific notes to individual KPI fields by clicking the Comment icon. These comments are timestamped and attributed to the user, with options to edit or delete them as needed.
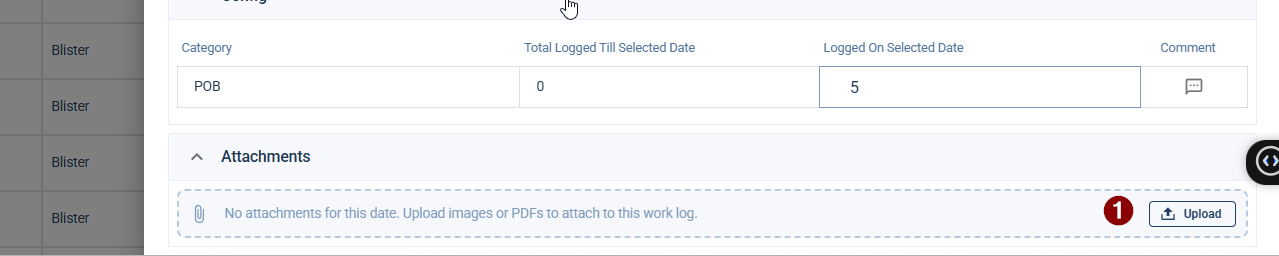
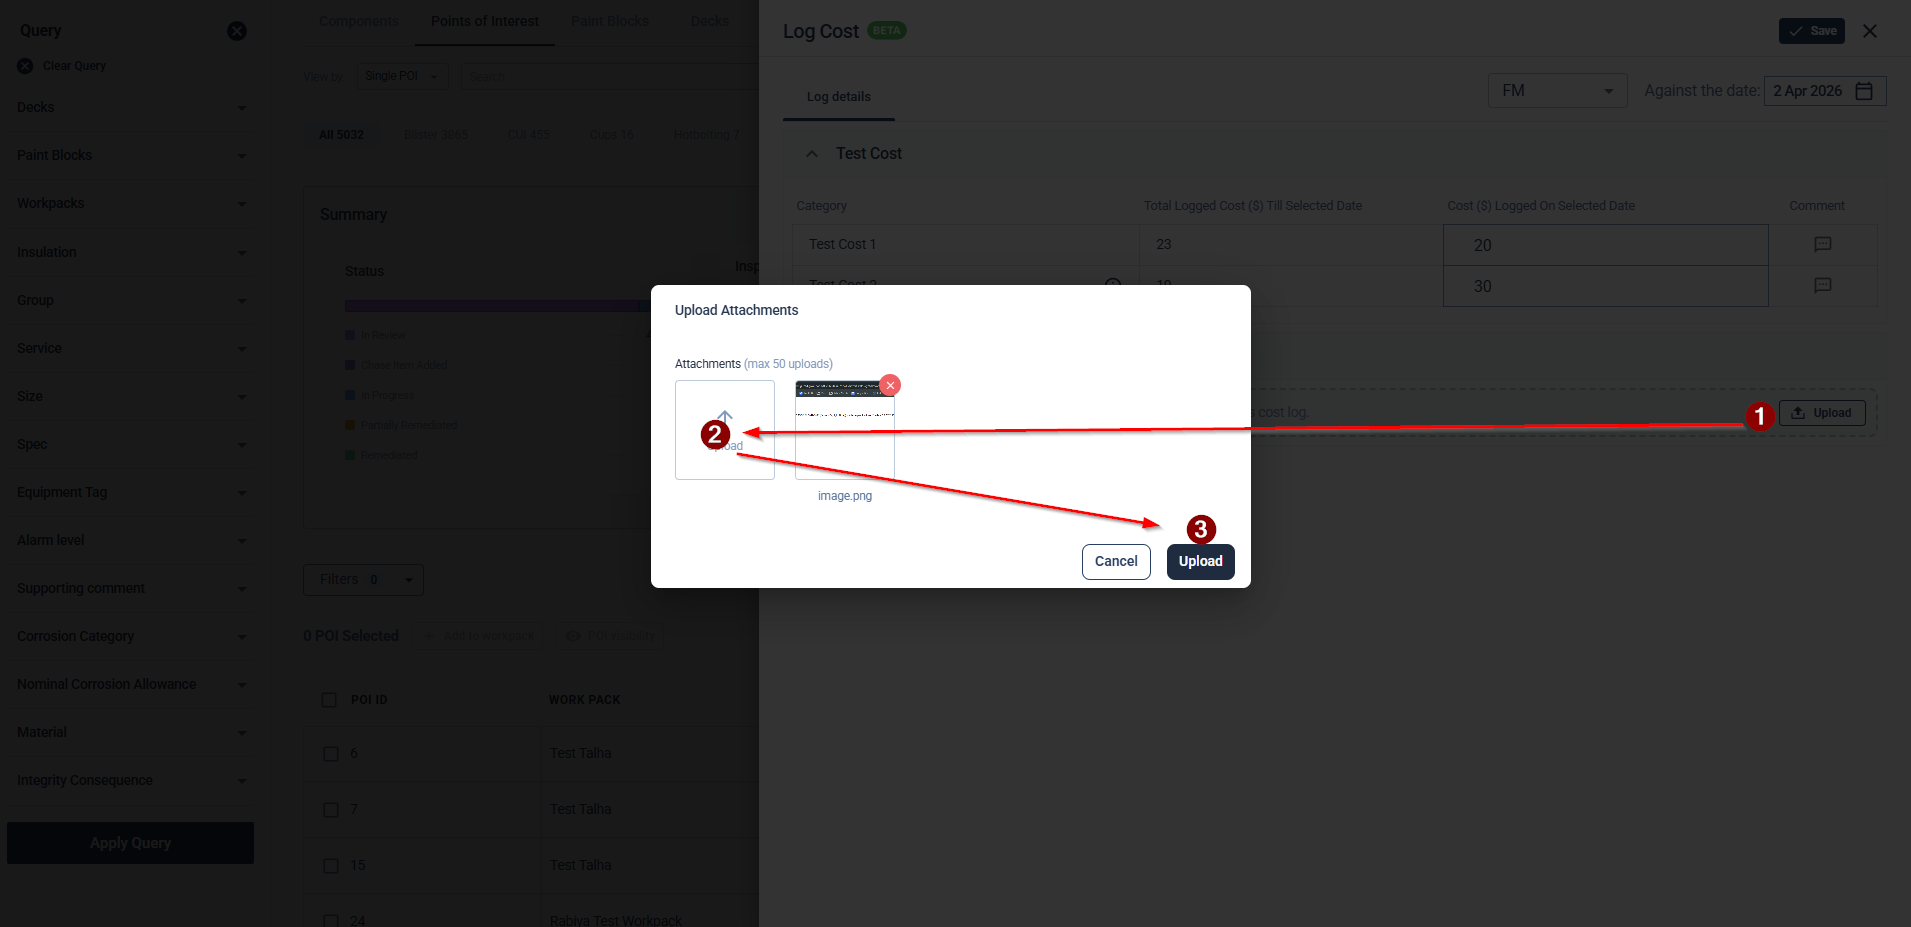
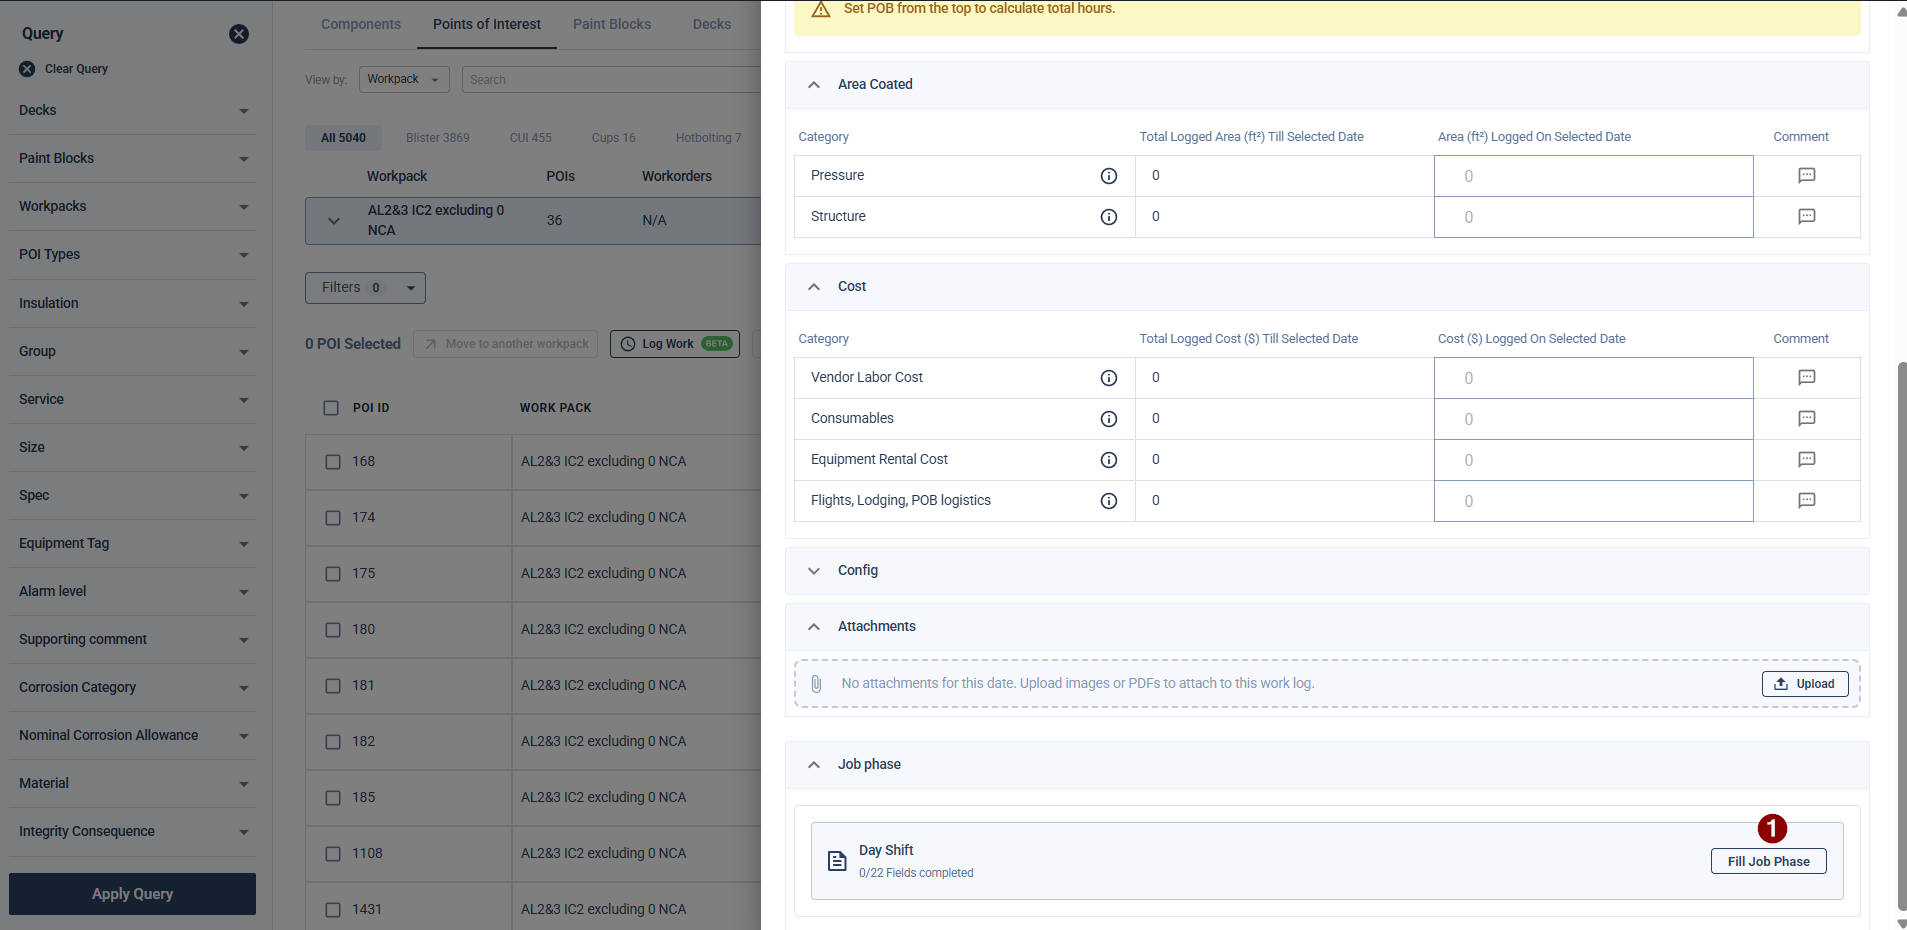
Upload supporting documentation or images (up to 50 files) in the Attachments section. Supported formats include PDFs and image files, which can be previewed directly within the platform.
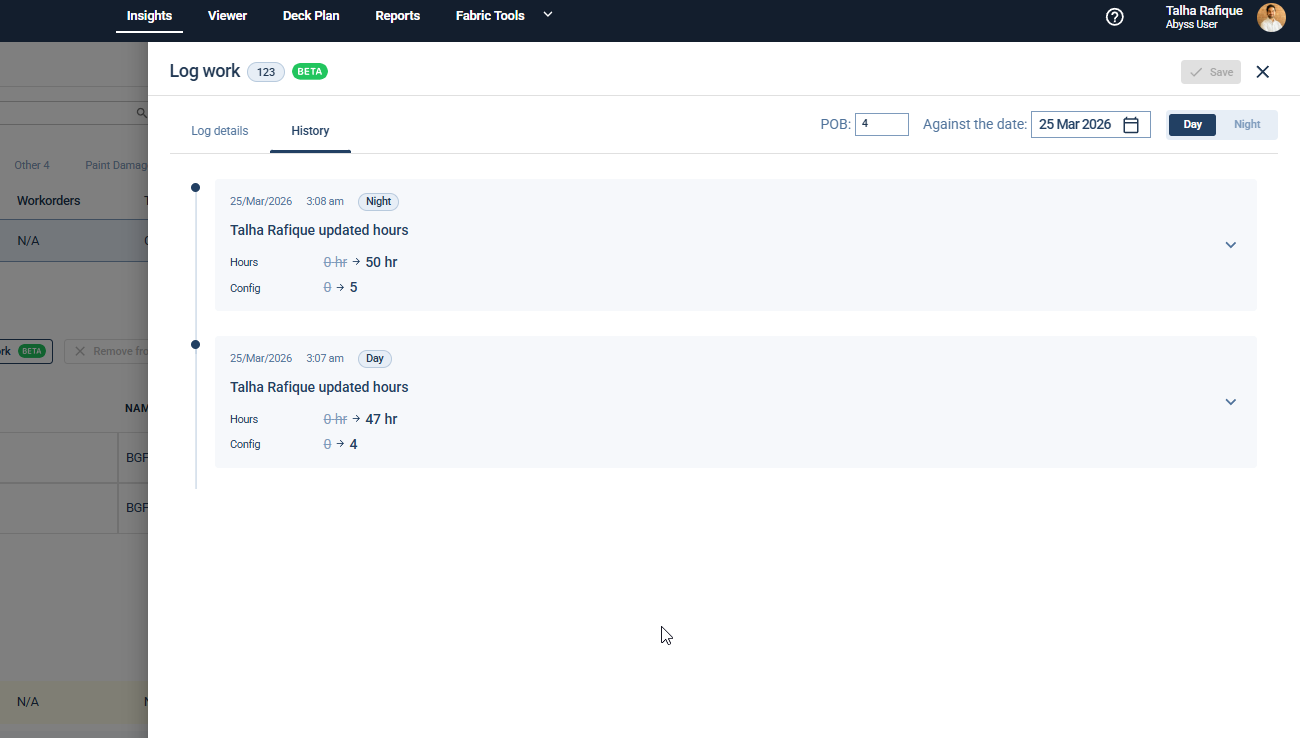
Review the History tab to see a chronological log of all actions taken for that date and shift, including data entries, comments added, and files attached.
Click Save to record all changes made for the selected date.
Part 2: Cost Logging
Log in to the platform and select the Insights tab from the top navigation bar.
Under Insights, click on the Points of Interest sub-tab.
Click the Logs button (located near the 'Add to report' and 'Export' options).
From the dropdown menu, click Log Cost.
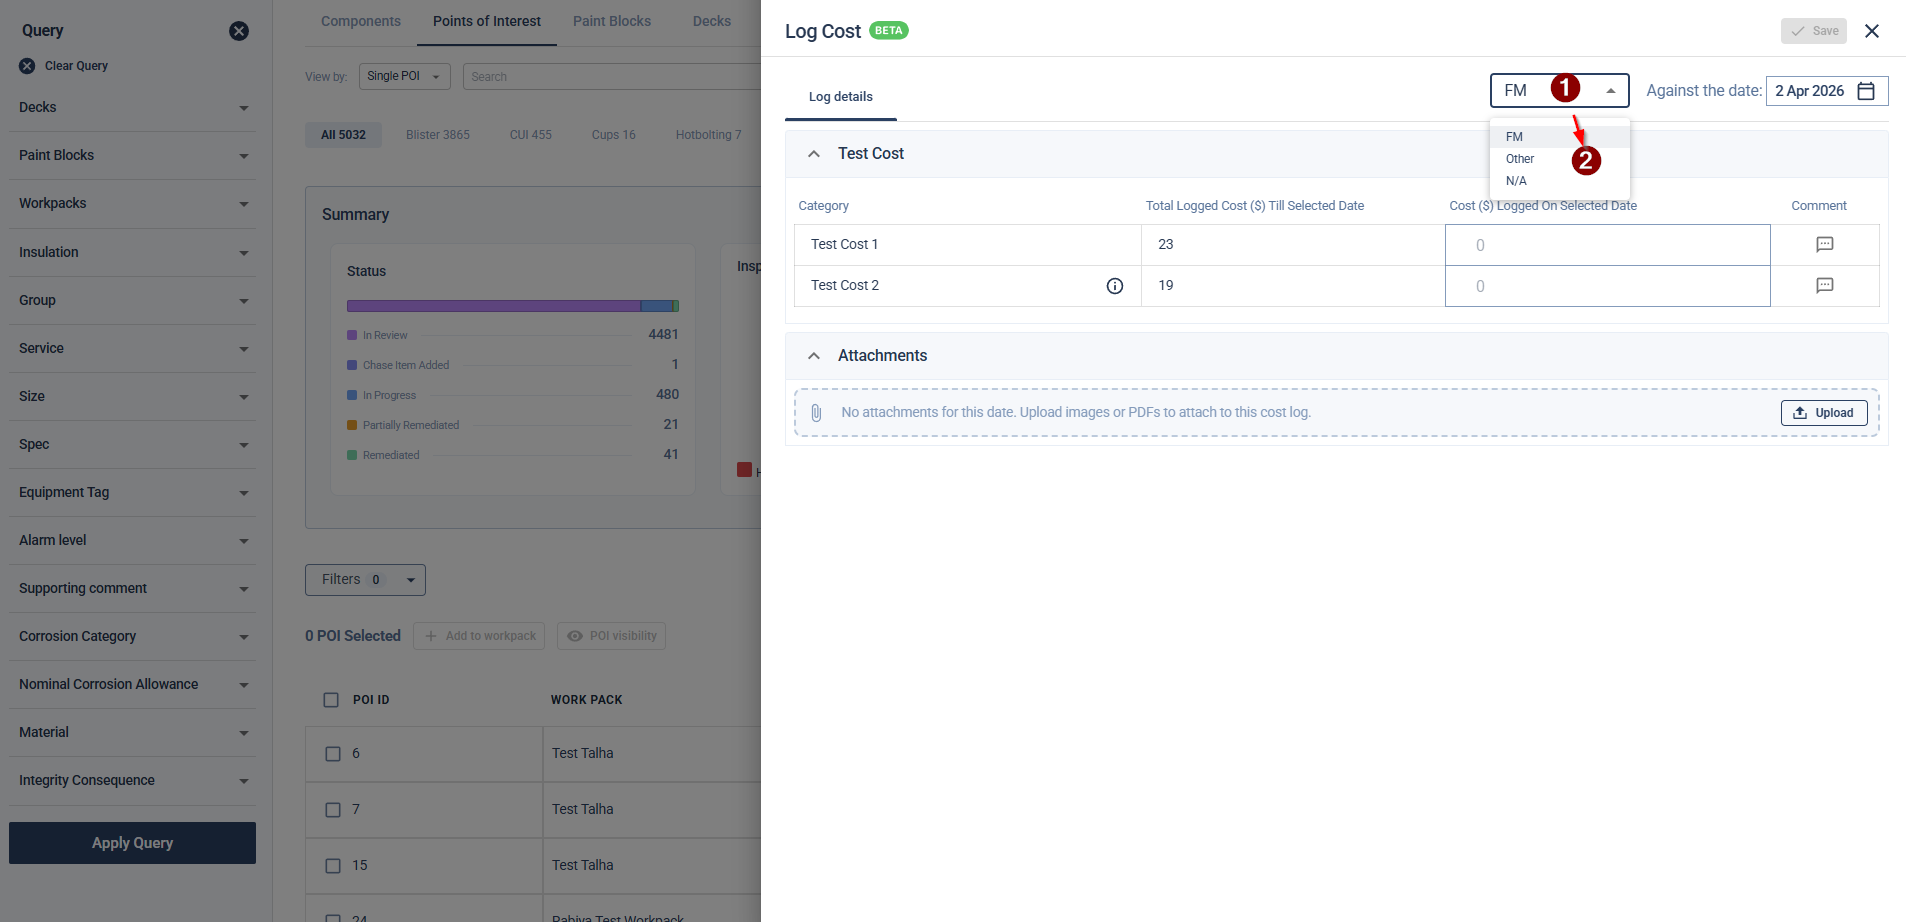
Configure Log Details:
Use the calendar picker to choose the specific date for the entry.
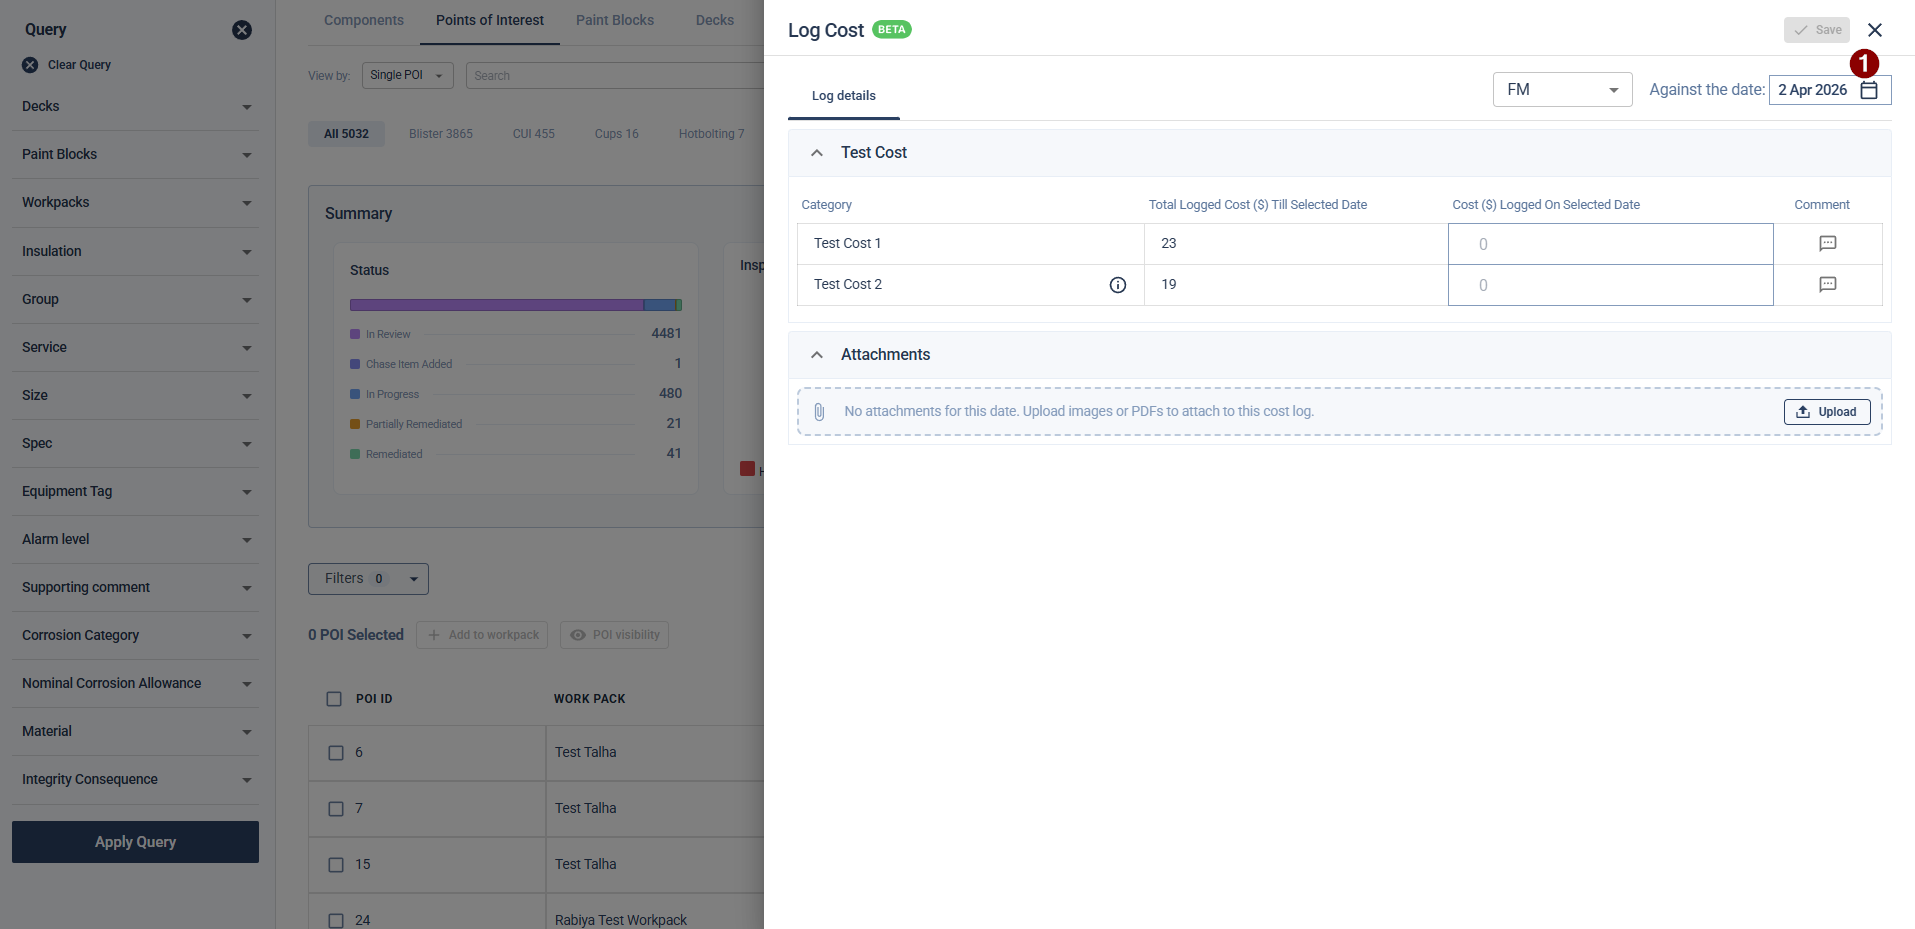
Select the appropriate category (e.g., FM cost) from the dropdown.
Enter Cost Data:
Find the relevant category (General, Labor, Flights, etc.).
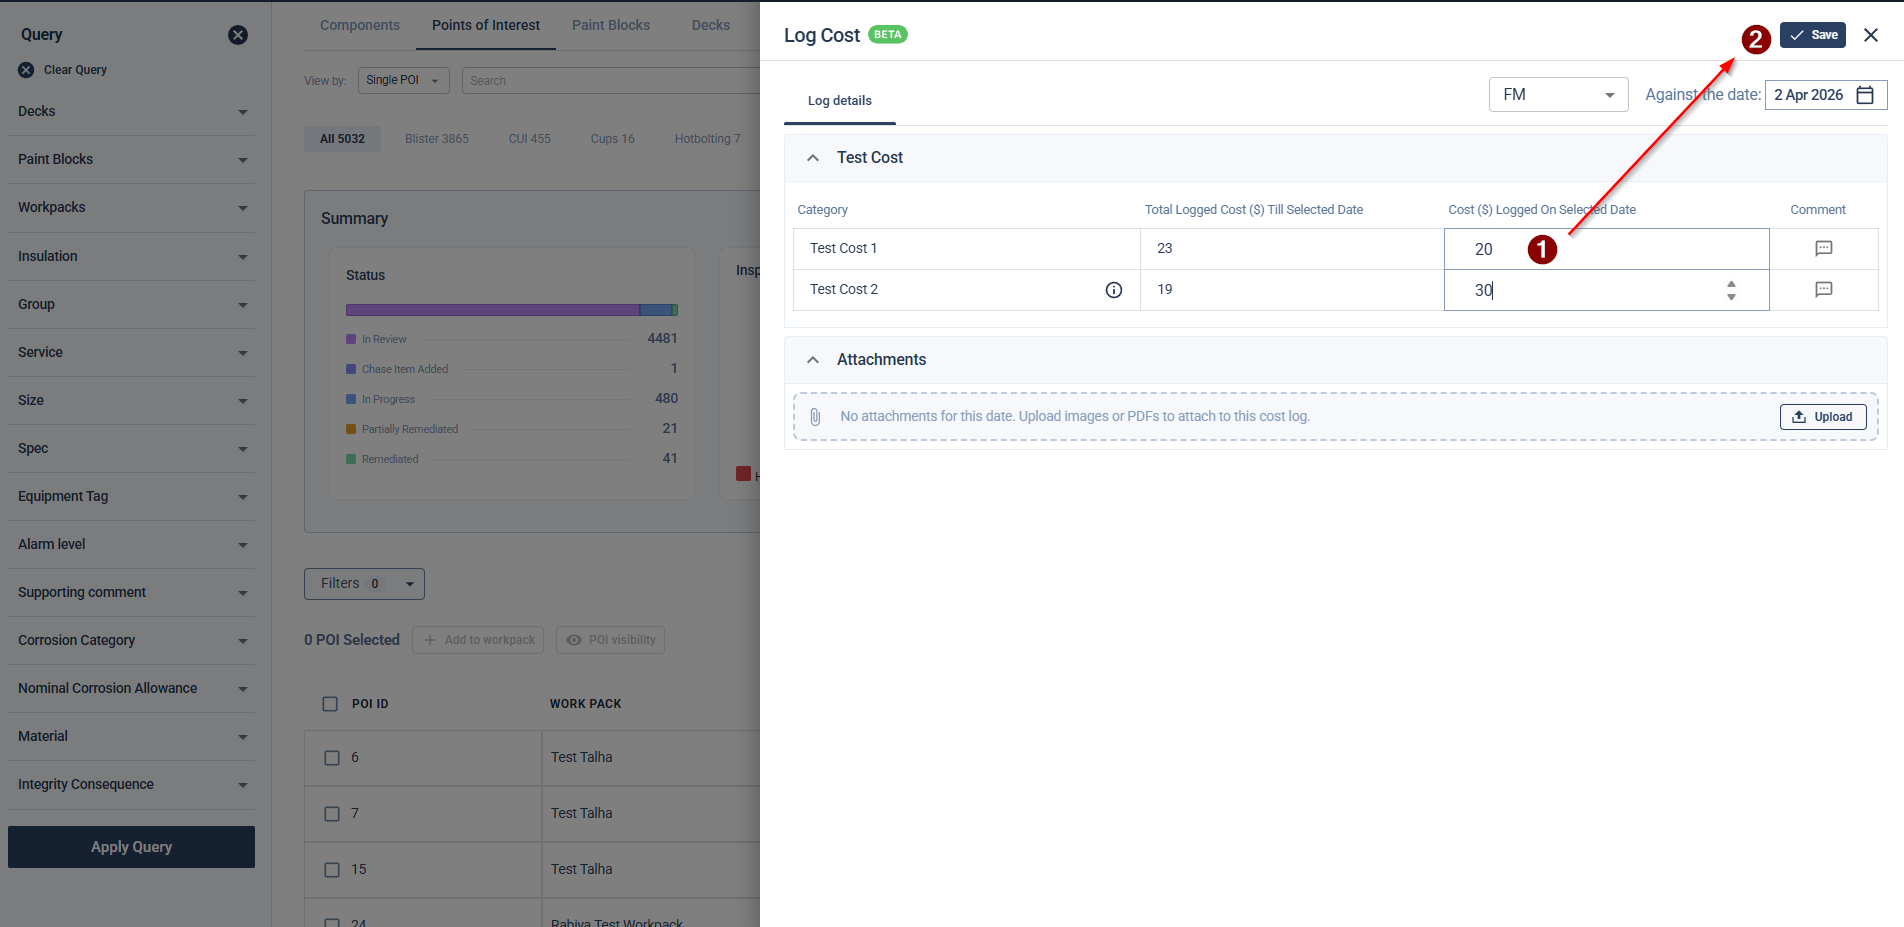
Input the value in the Logged cost on selected date column.
The Total logged cost column will automatically update to show the cumulative sum for that field up to the selected date.
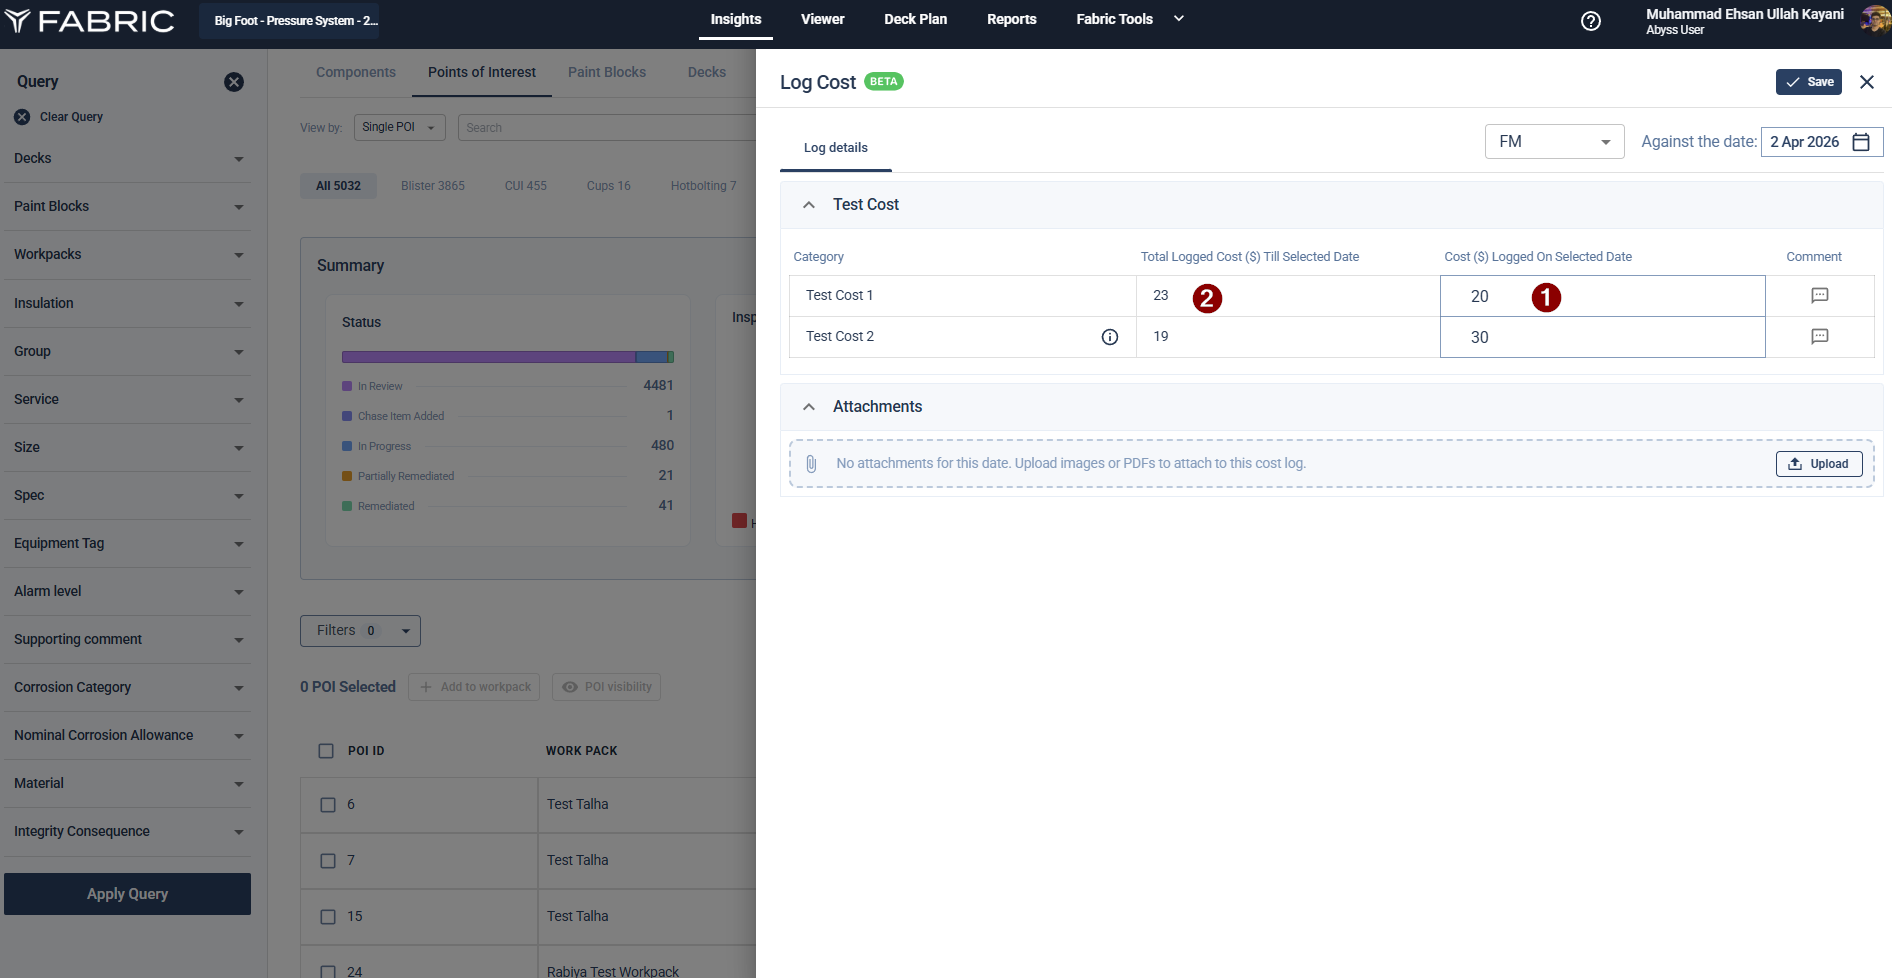
Click the Comment icon next to an entry to add specific notes.
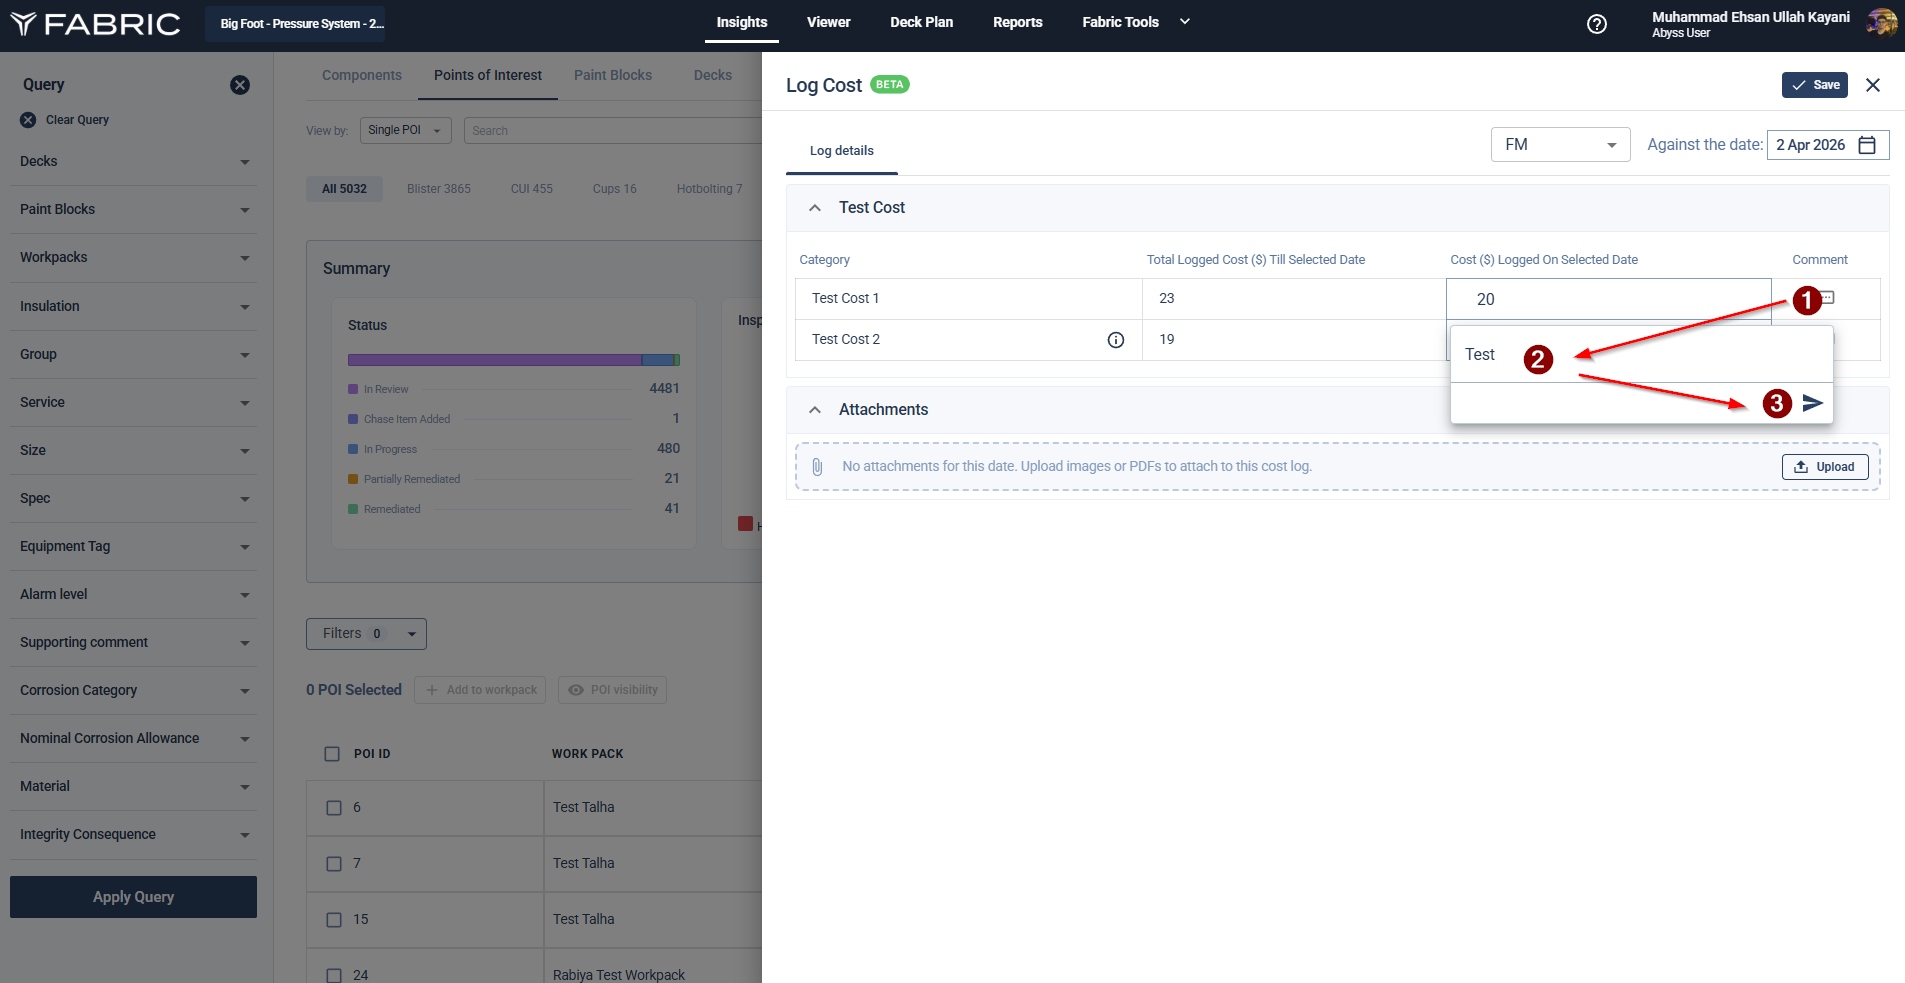
Use the Attachments section at the bottom to upload relevant images or PDF invoices.
Click the Save button at the top right to finalize the entry.
Part 3: Indirect POB Logging
Go to the Insights tab and select Points of Interest.
Click the Logs button in the action bar.
Choose Indirect POB from the dropdown list.
Add Indirect POB Data:
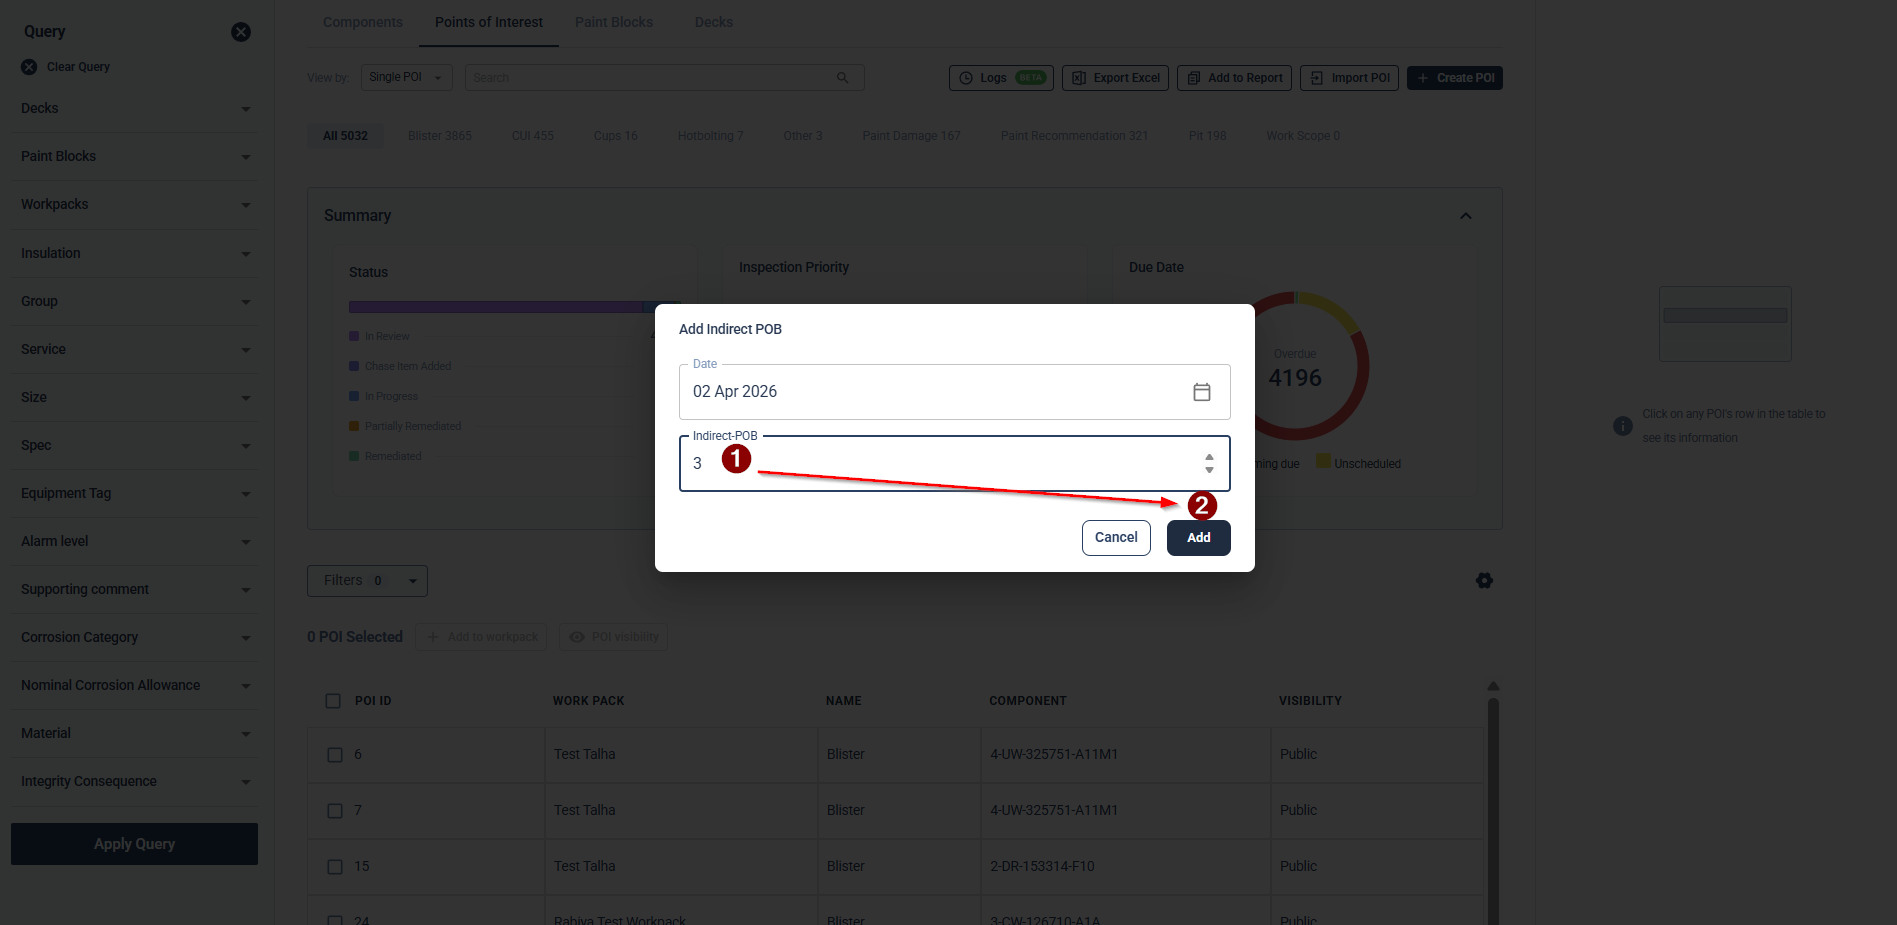
Select the date from the calendar in the pop-up window.
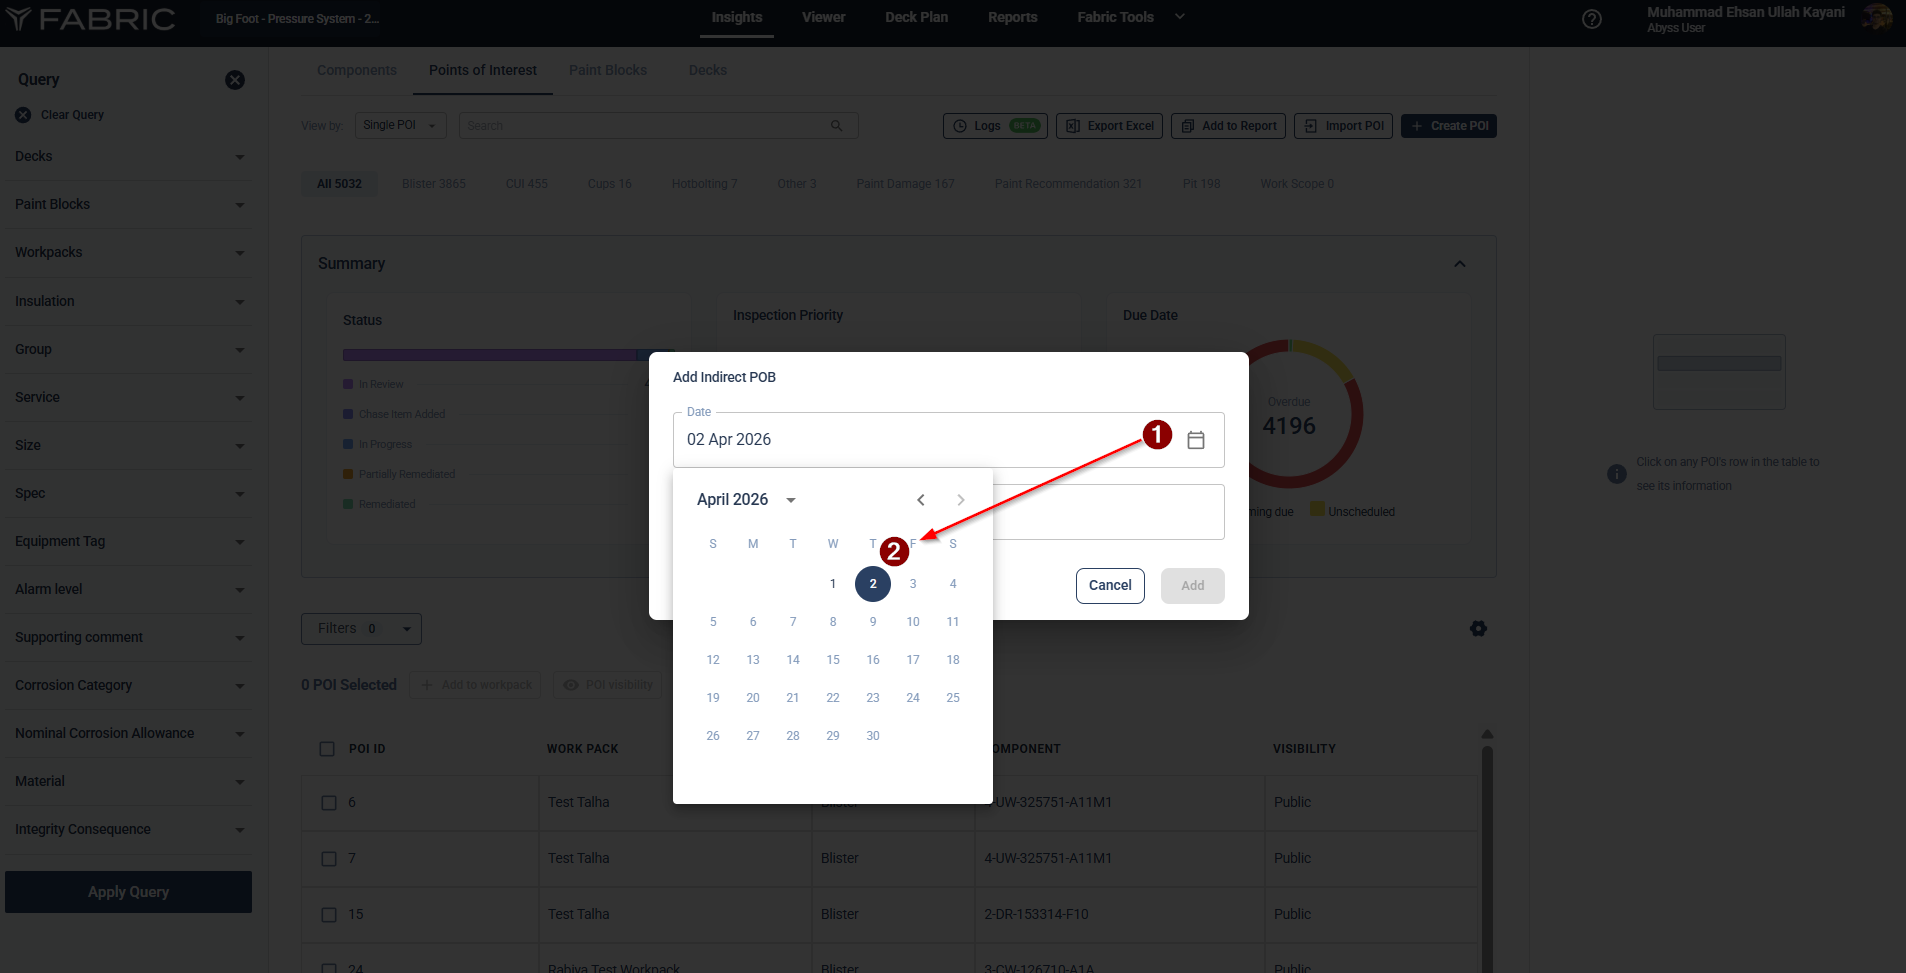
Enter the number of Indirect POBs for that day.
Click the Add button. The data will be logged and reflected on the platform’s main dashboard.
Part 4: Viewing Aggregated / Logged Data
Navigate to a Platform of your choosing.
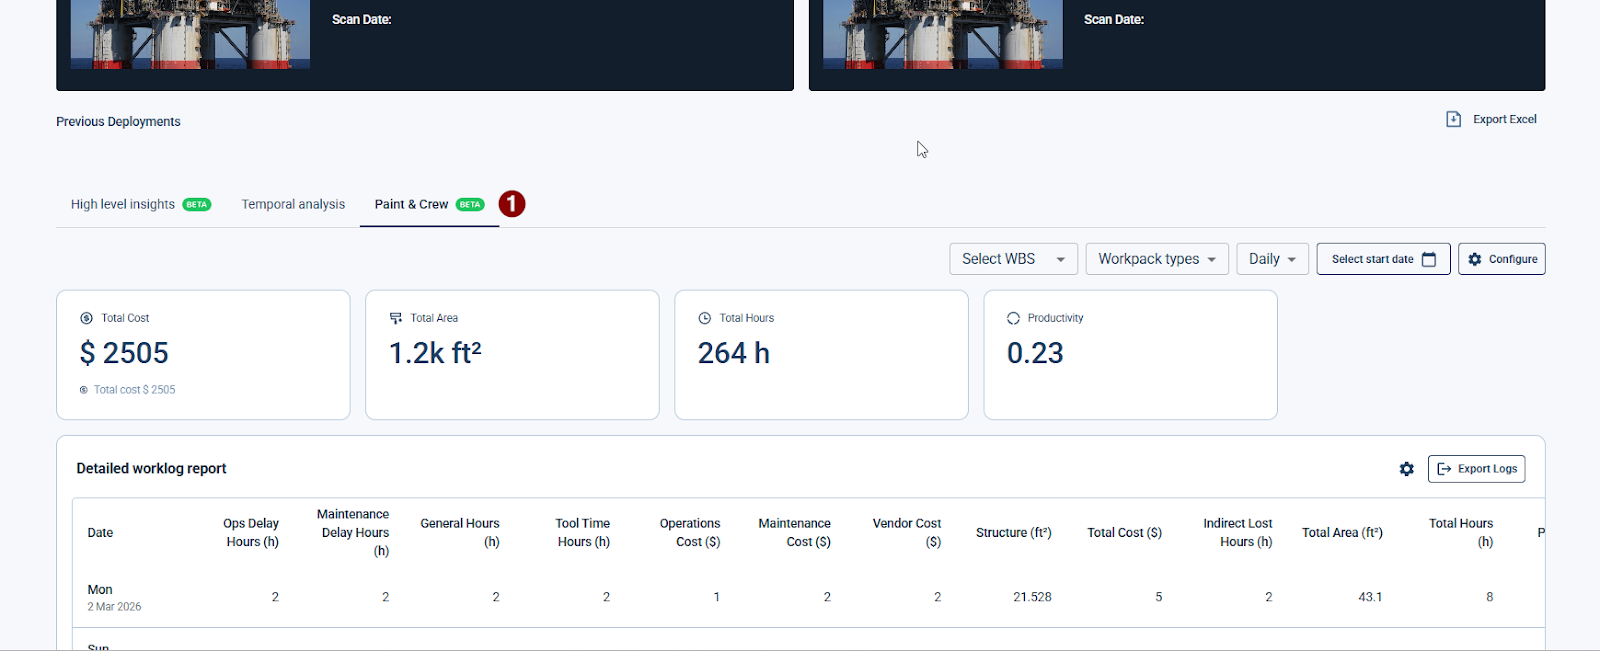
Click on the Paint & Crew button. This opens the KPI Dashboard, where all logged inputs are displayed.
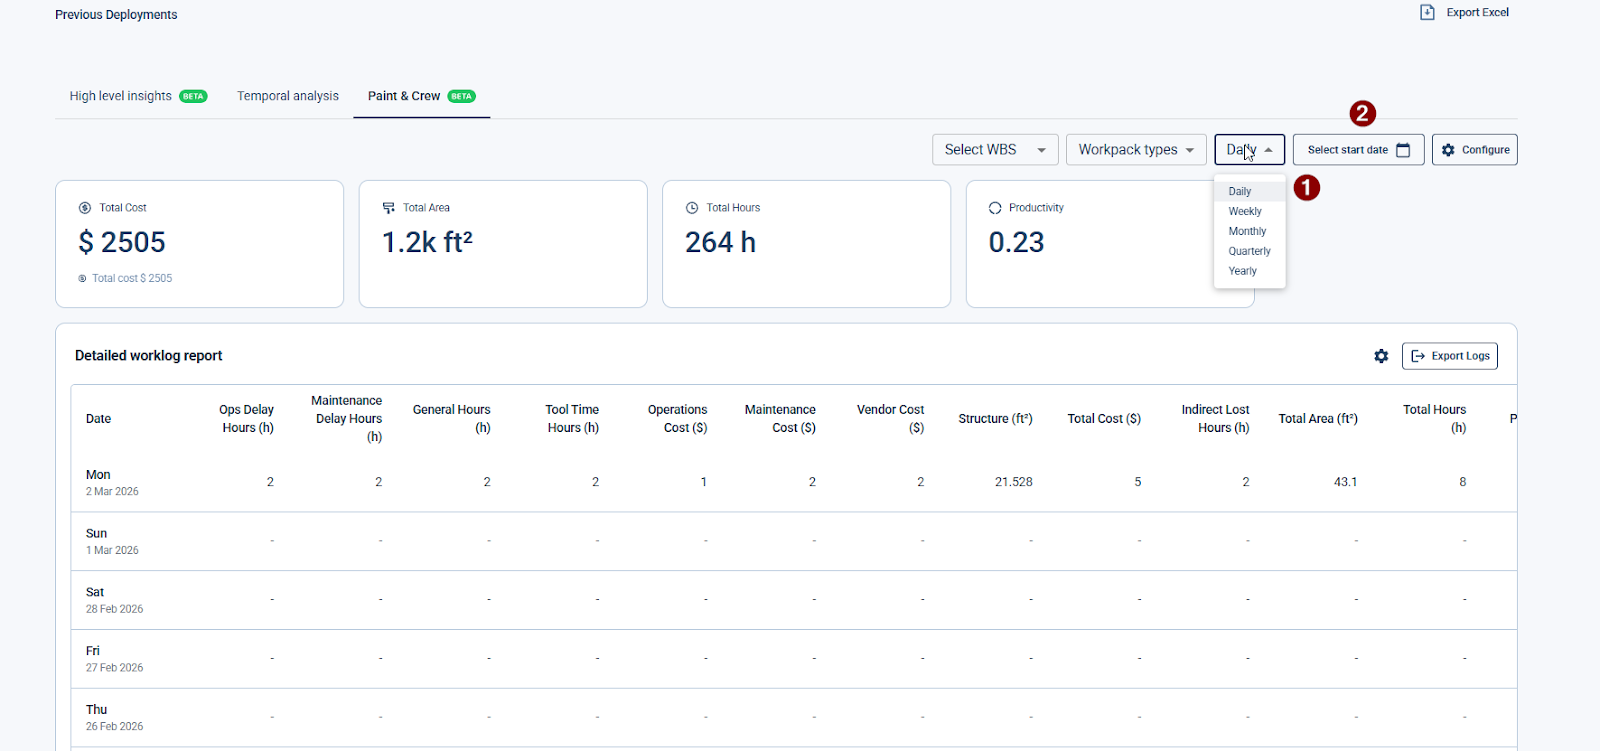
Adjust the Time View as needed:
Daily
Weekly
Monthly
Quarterly
Alternatively, set a Custom Date Range (e.g., 1st January to 15th January) to view data for a specific period.
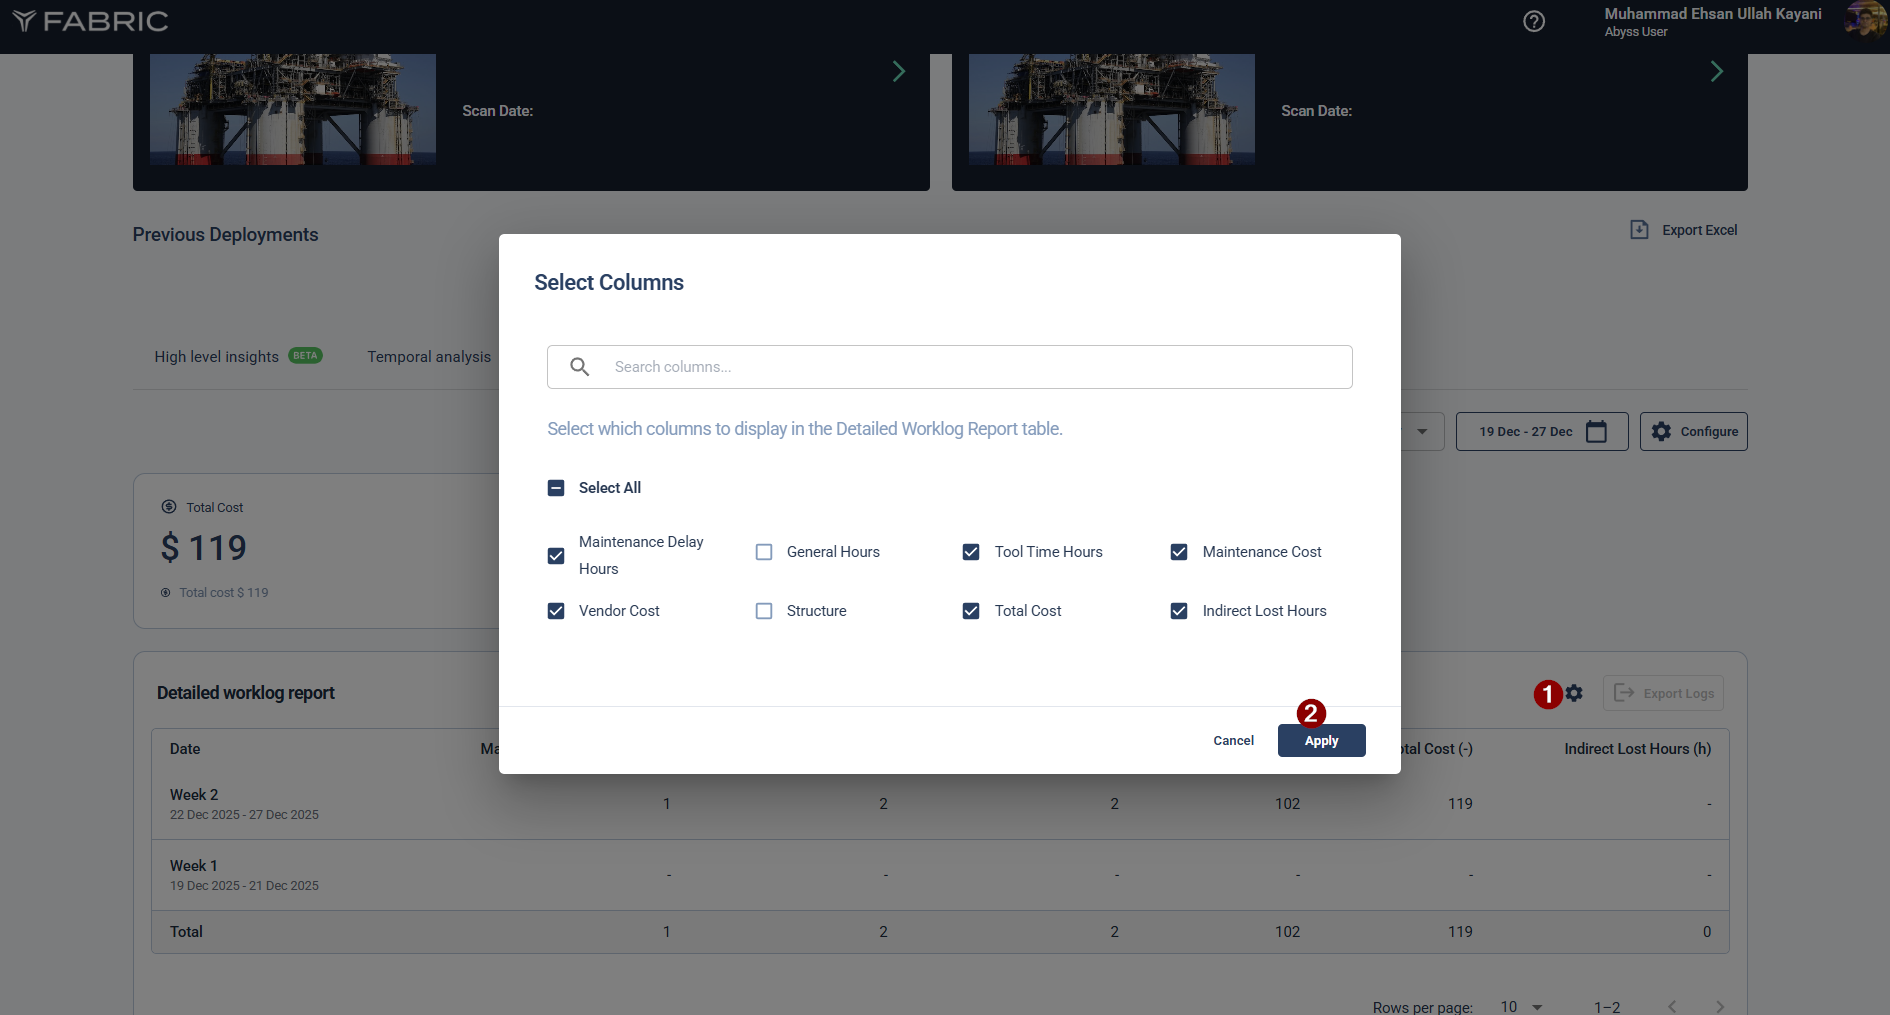
Configure the table by selecting the Columns you want to display.
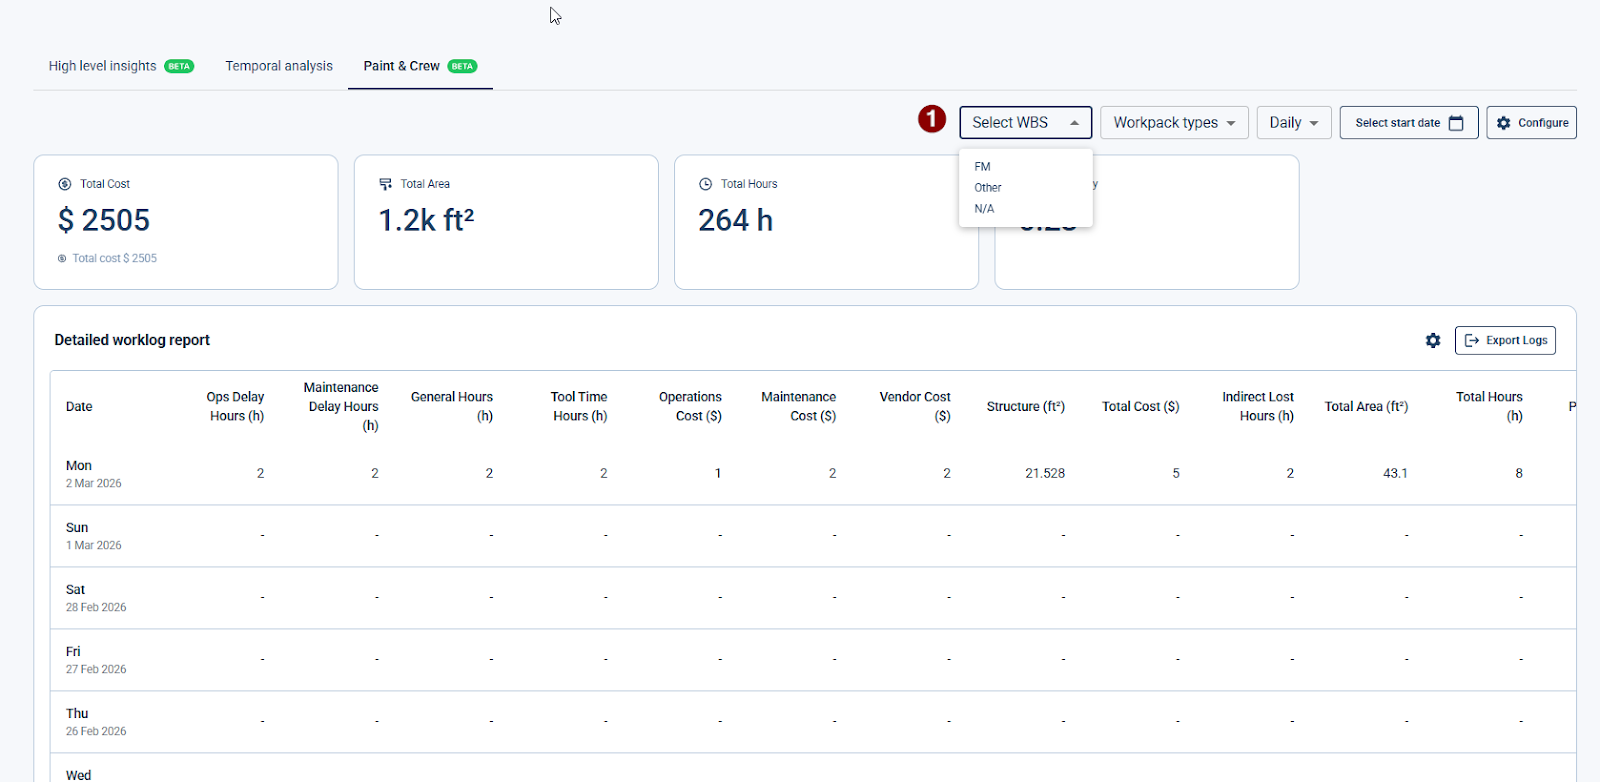
Select WBS: Filter data by Work Breakdown Structure (e.g., FM, Other, or N/A).
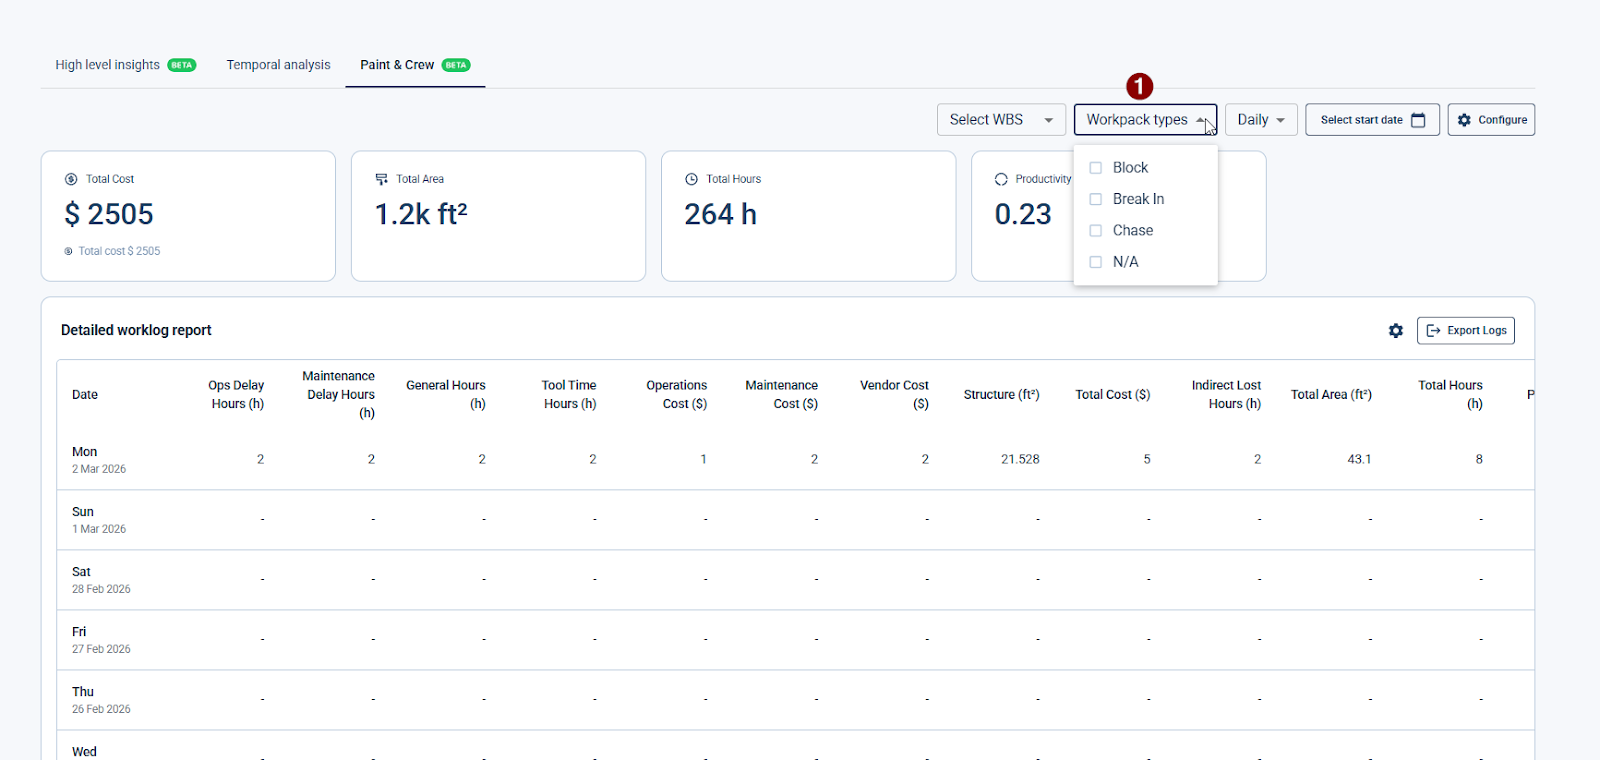
Workpack types: Filter by specific workpack categories, such as Block, Break In, Chase, or N/A.
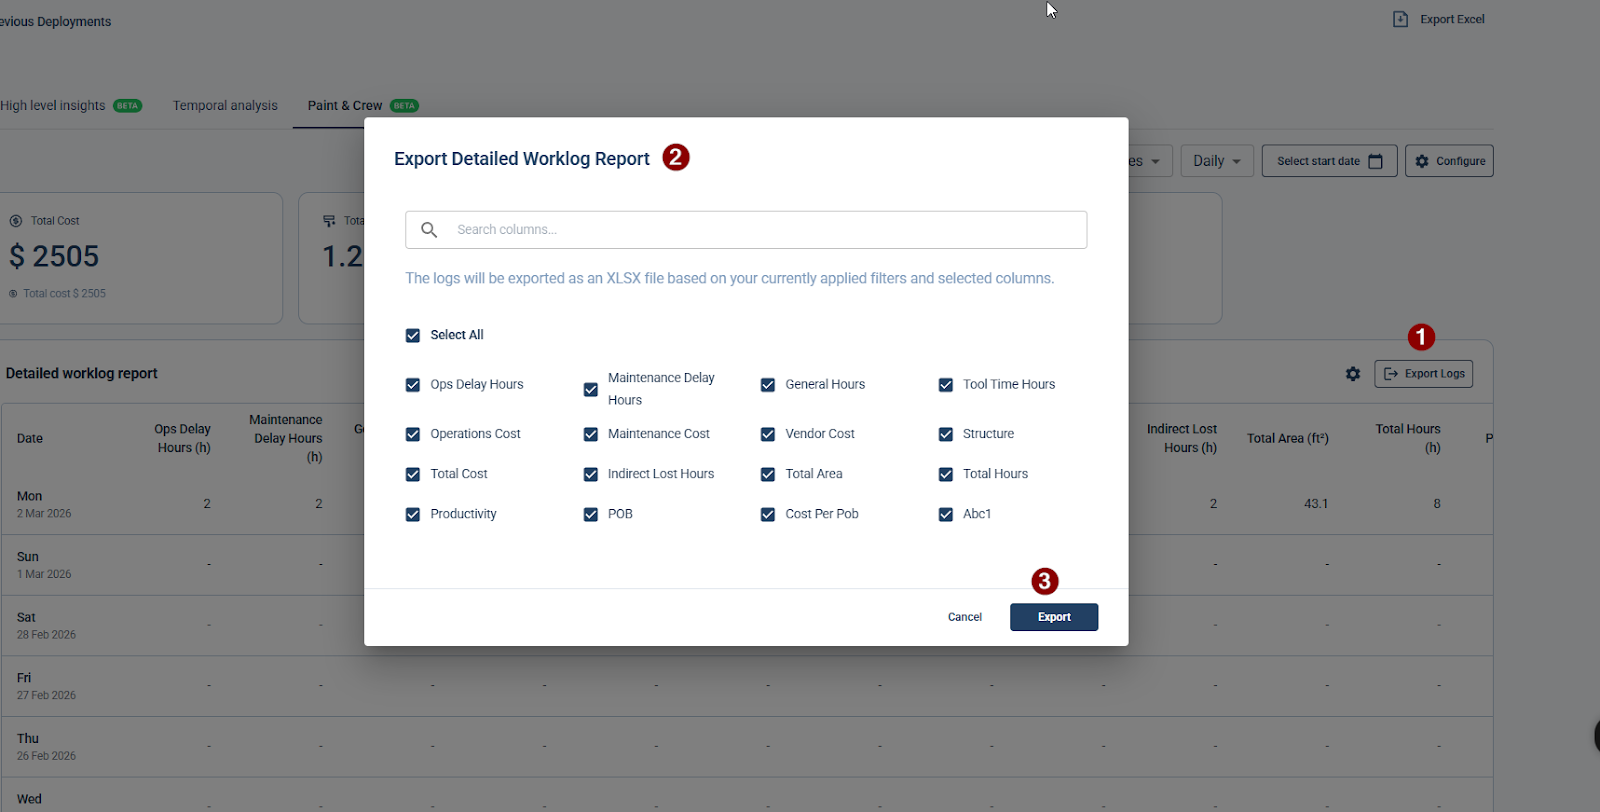
To download your data, click Export Log, select the specific columns you wish to include in the Export window, and click Export to generate an .XLSX file based on your currently applied filters.
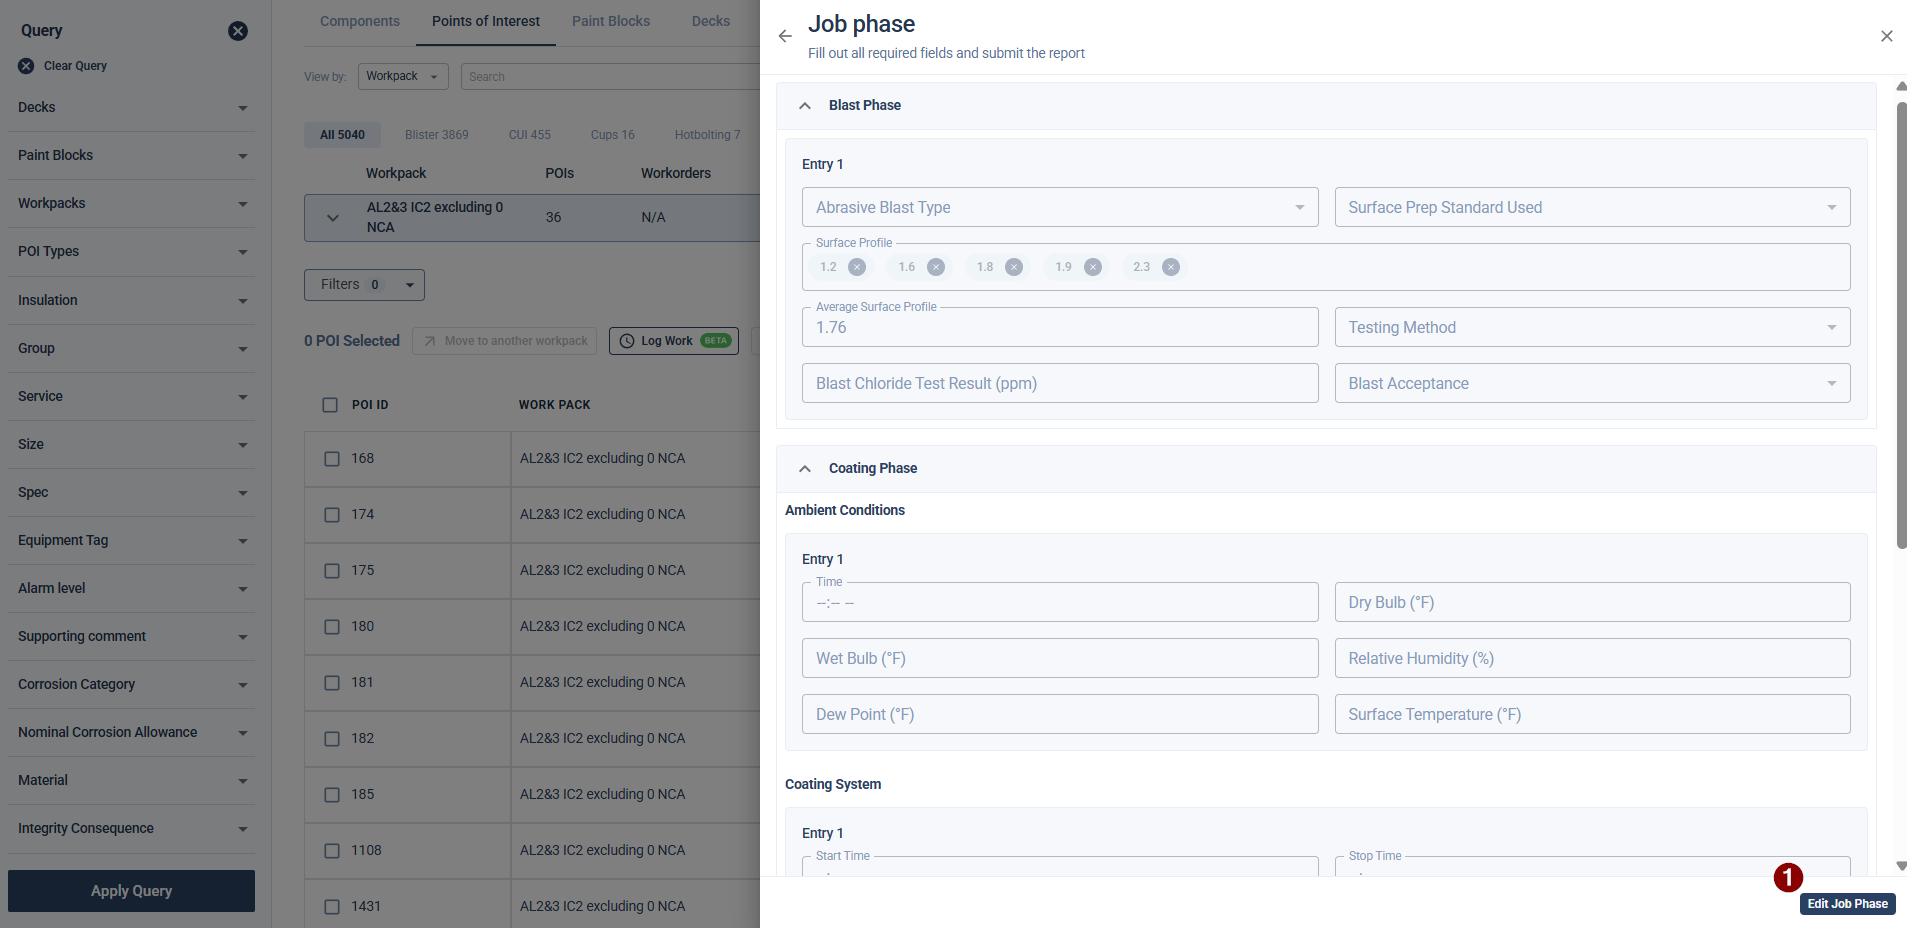
Part 5: QA/QC Tracking (Job Phase Form)
1. Accessing the QA/QC Form
Navigate to the Log Work screen and select the Log details tab.
Select the specific Date and Shift (Day or Night) for which you want to record data.
Scroll to the bottom of the page and click the Fill Job Phase button to open the form.
2. Filling Out the Form
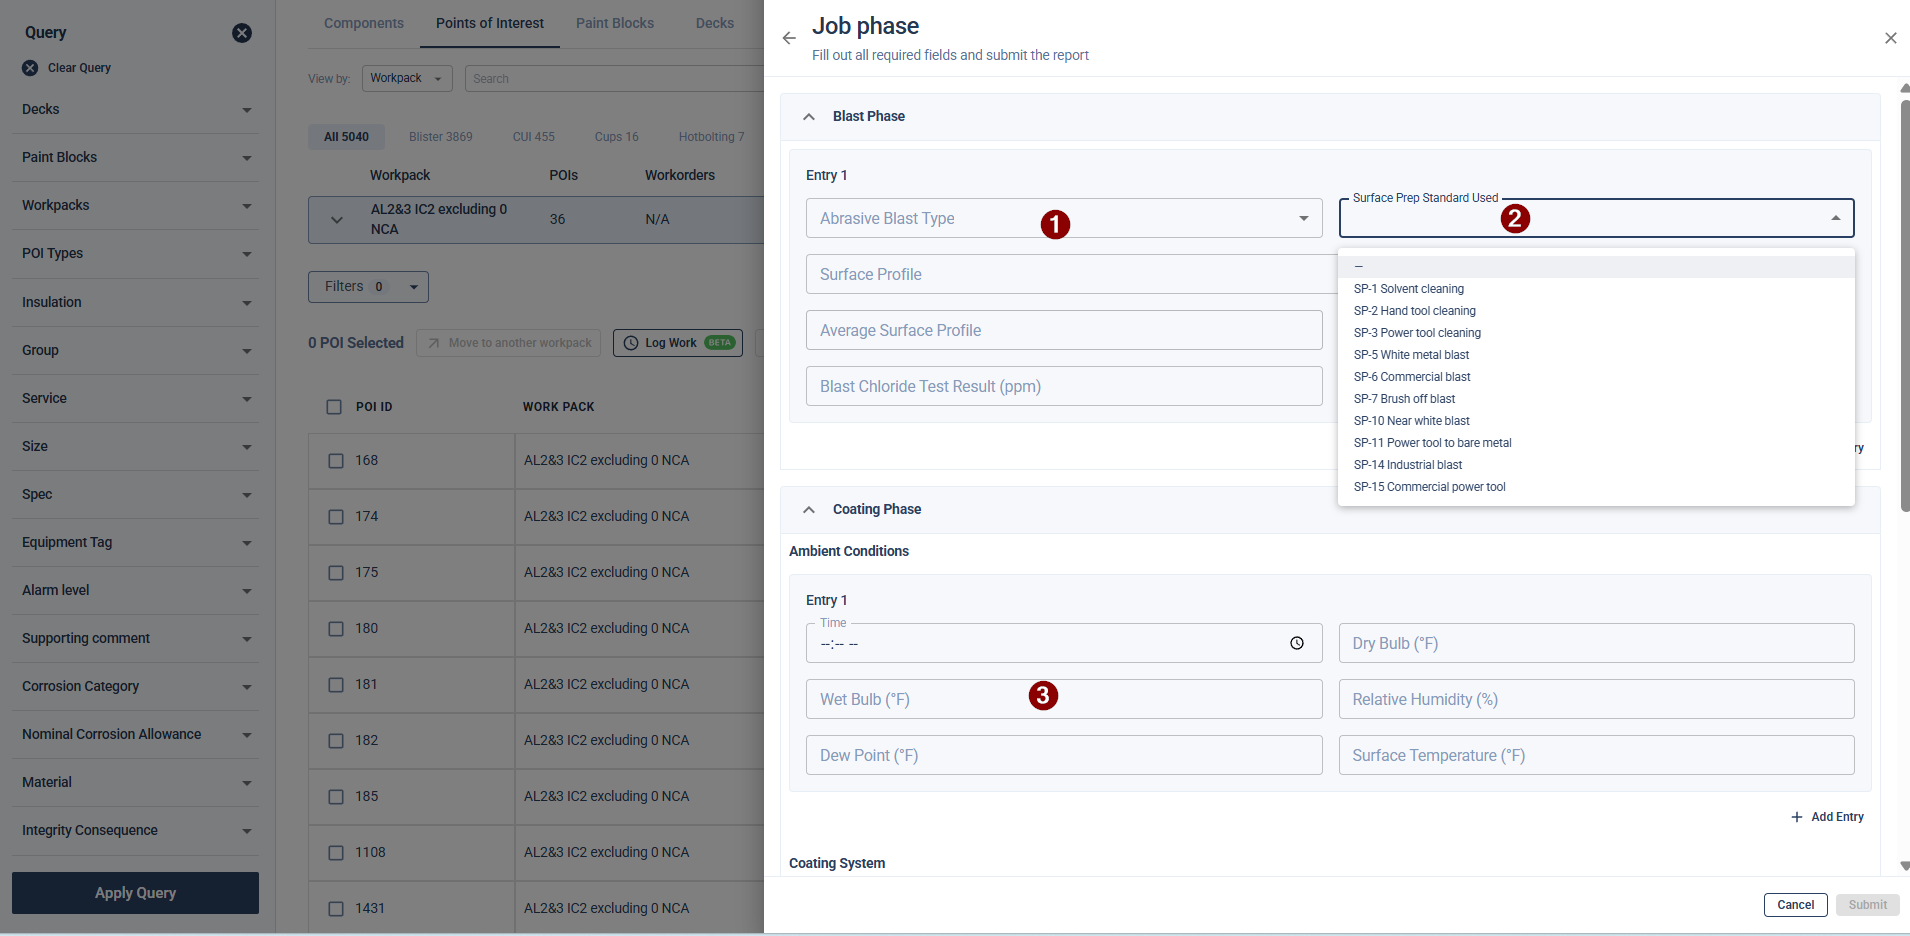
The Job Phase form is divided into two primary sections containing standard dropdowns, text fields, and numeric inputs:
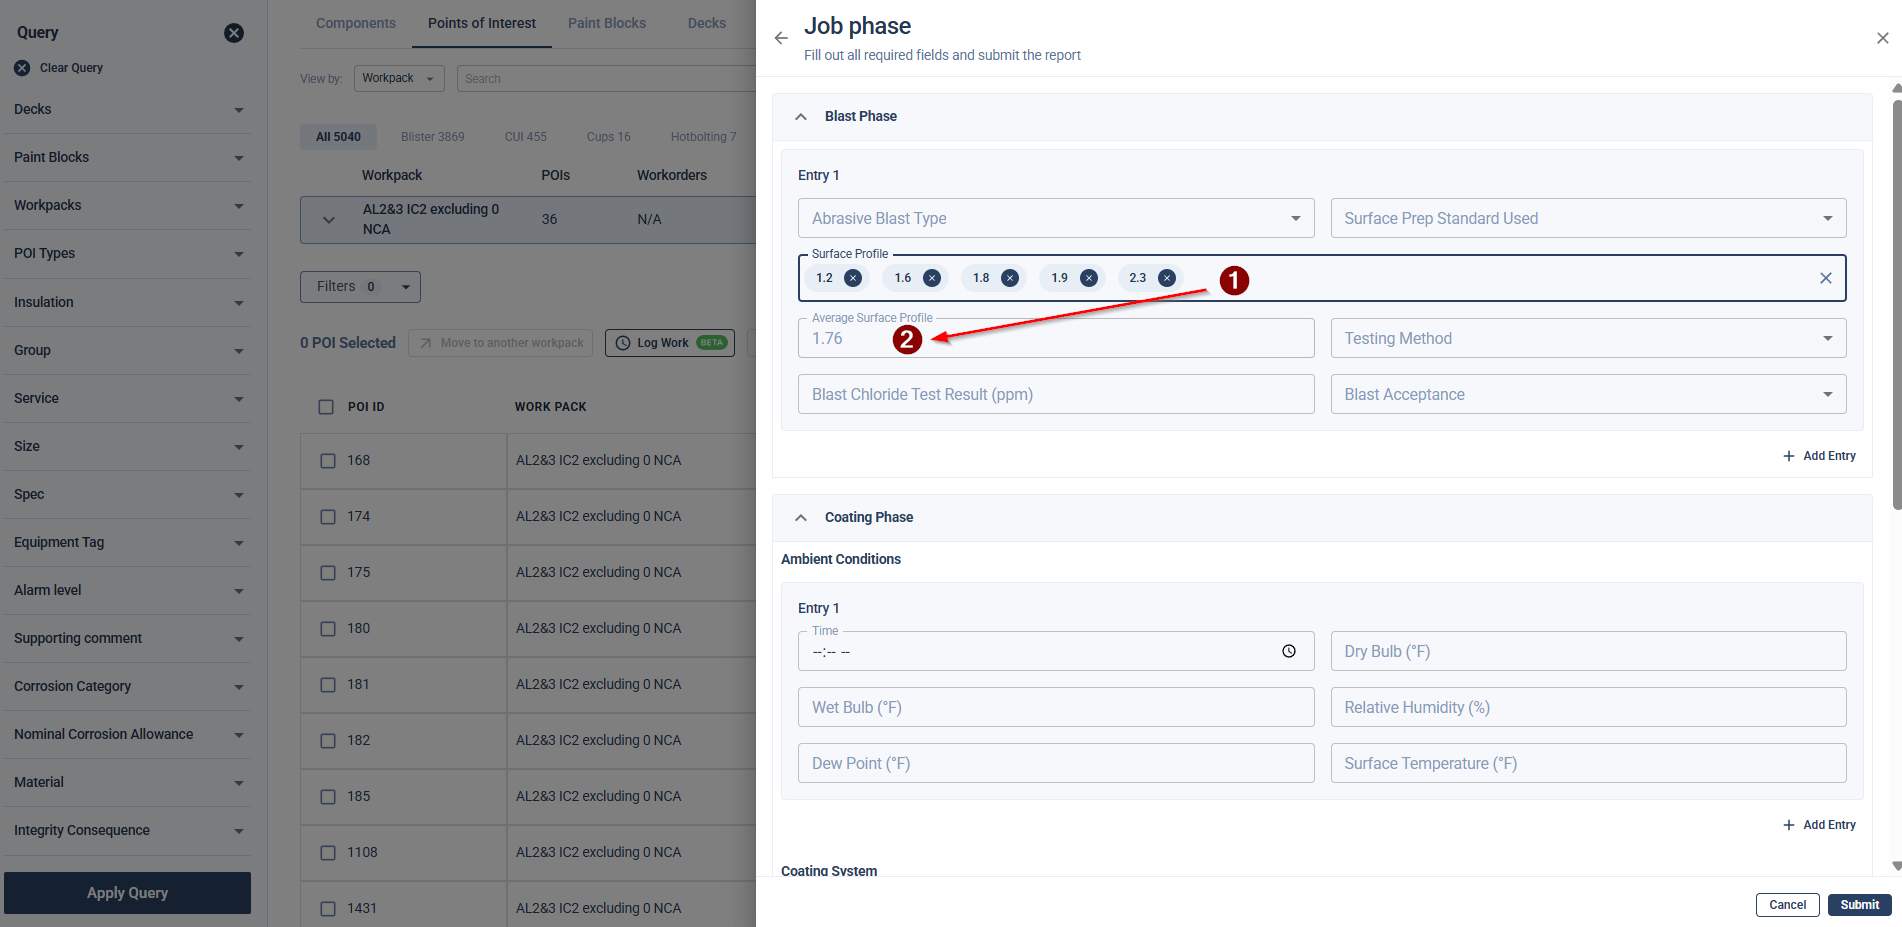
Blast Phase
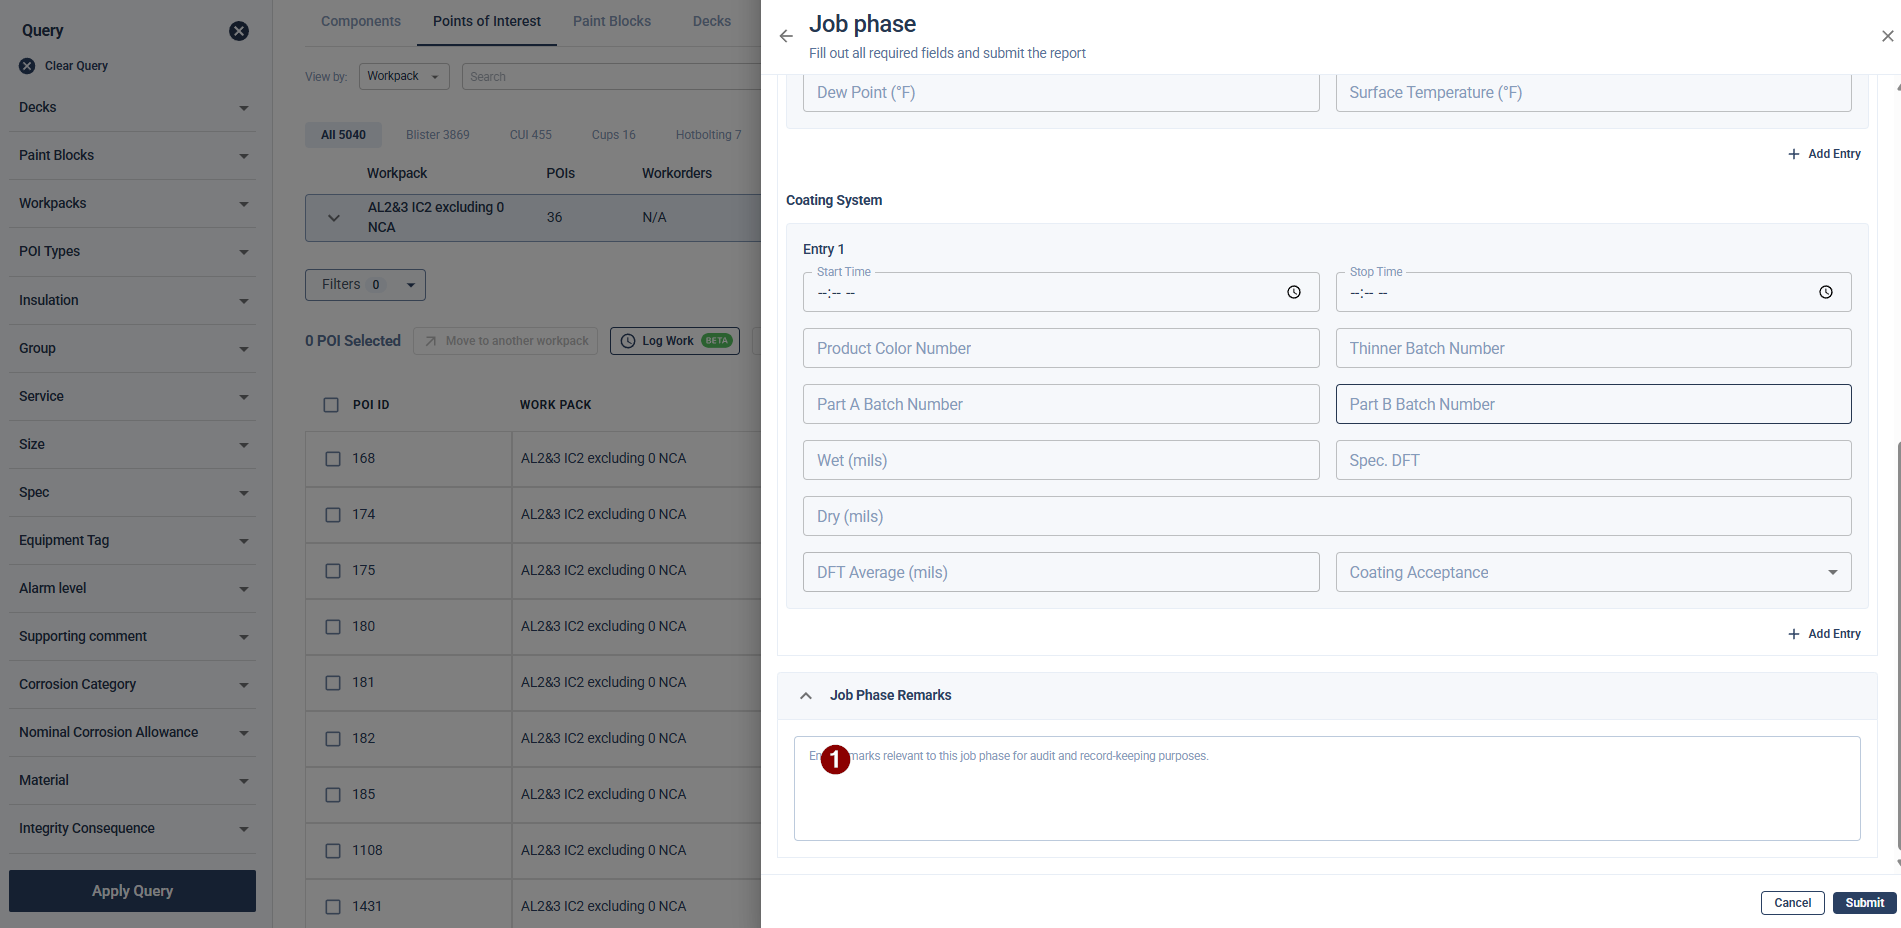
Coating Phase (This is further divided into two sub-sections: Ambient Conditions and Coating System)
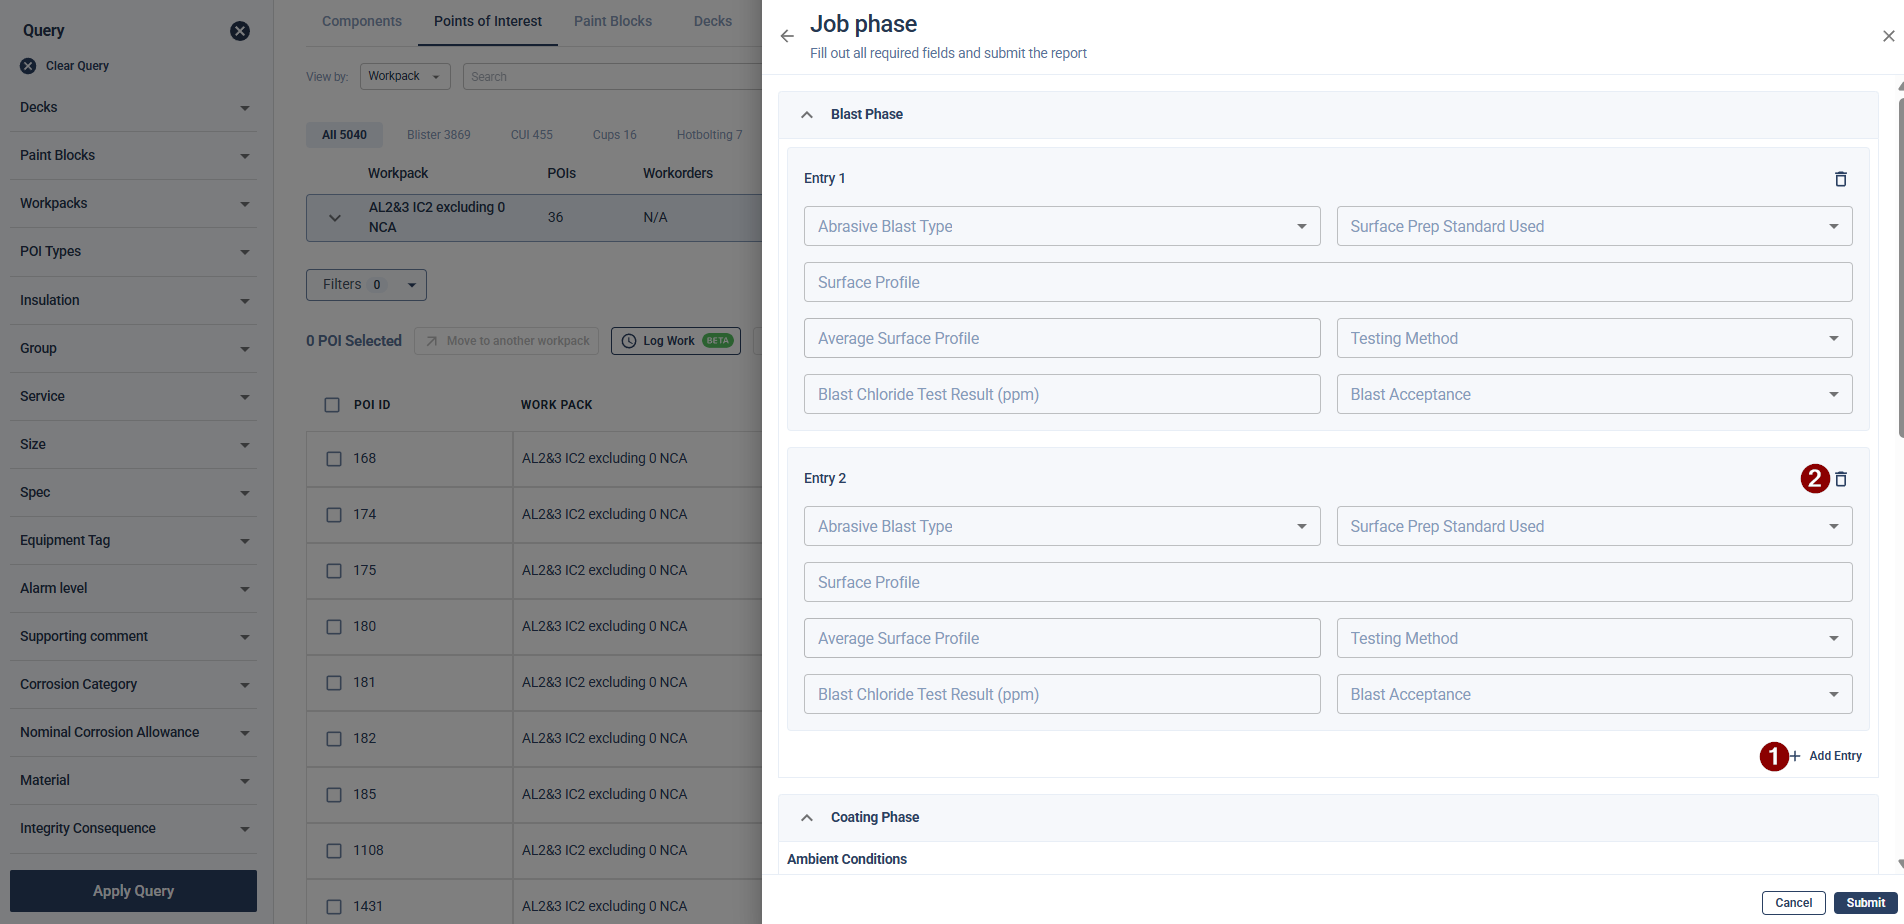
Managing Entries
By default, each section starts with a single entry block (e.g., Entry 1). You can add multiple entries if required.
Add an Entry: Click the Add Entry button to create a new, blank entry block (e.g., Entry 2).
Remove an Entry: Click the Delete icon next to an entry you no longer need.
Multiple Value Fields and Automated Averages
There are specific fields in the form designed to take multiple readings.
Blast Phase (Surface Profile): To add multiple surface profile readings, type a numerical value into the Surface Profile field and press Enter. You can add as many readings as needed. The Average Surface Profile field will automatically calculate and display the average of your inputs.
Coating System (Dry mils): Similarly, type a reading into the Dry (mils) field and press Enter to add multiple readings. The DFT Average (mils) field will automatically display the calculated average.
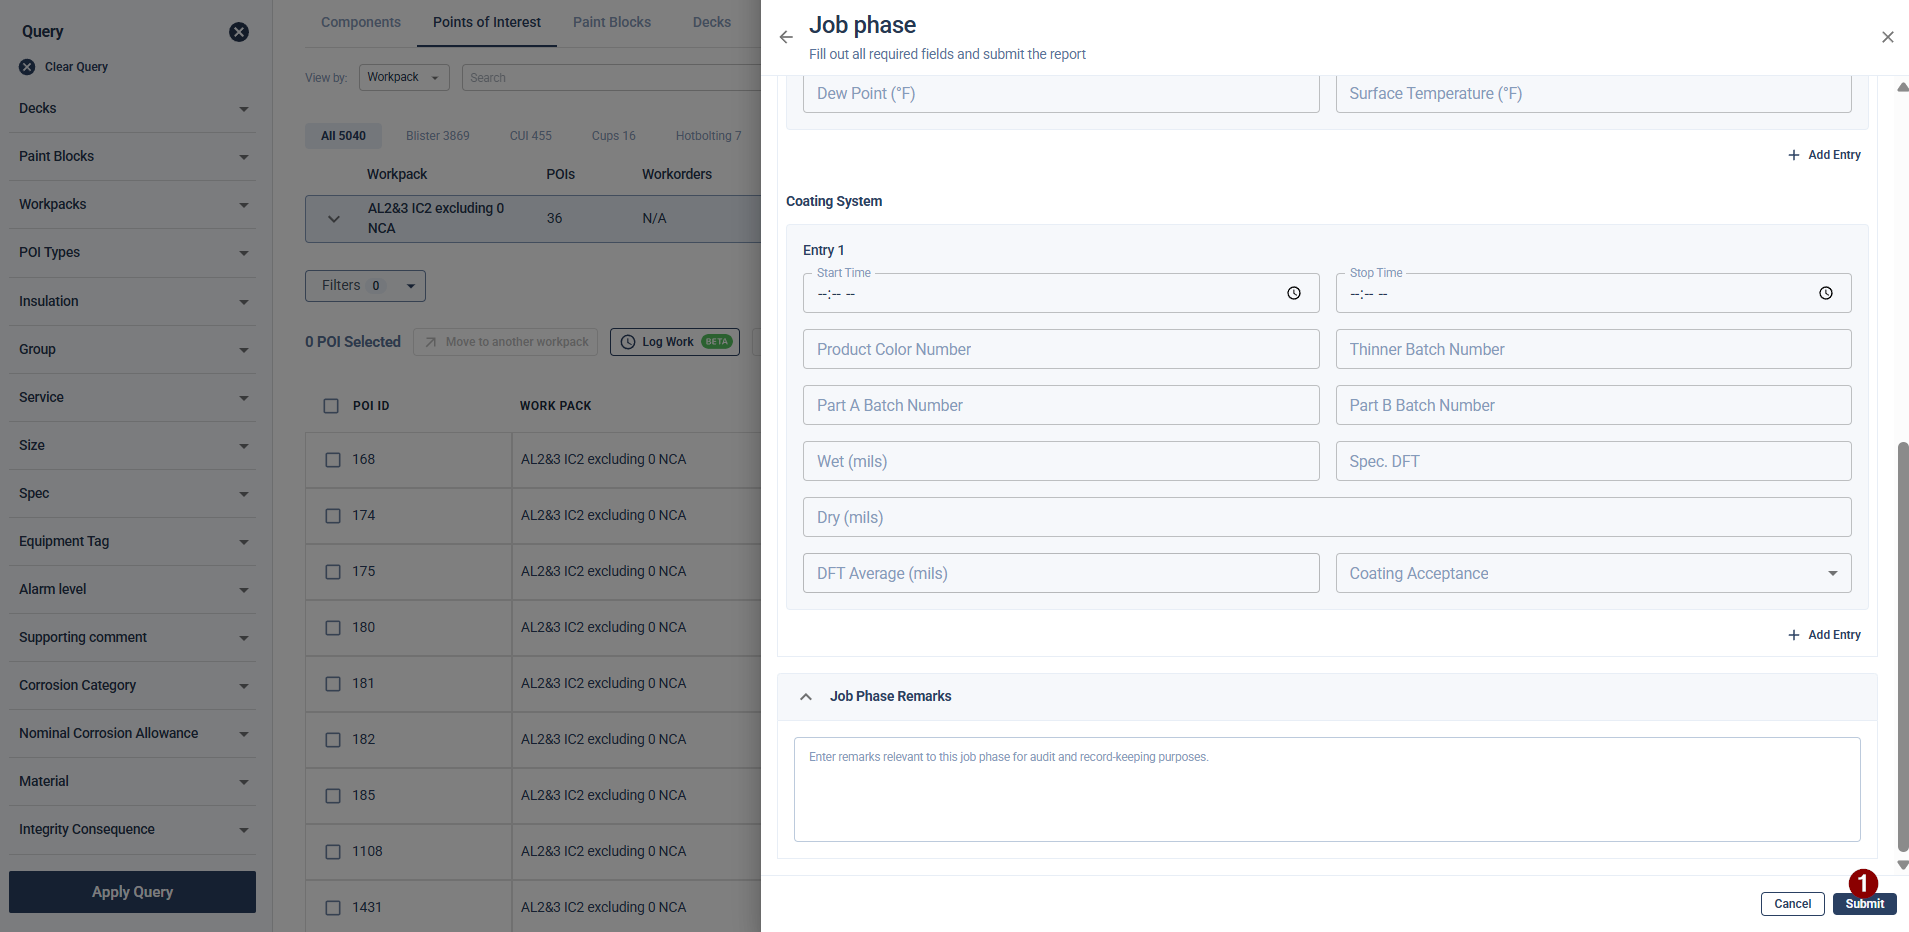
3. Submitting the Form
At the very bottom of the form, you can optionally add any general comments in the Job Phase Remarks text box.
Once all required fields are complete, click Submit.
A success banner will appear at the top of the screen stating, "Job phase form saved successfully!"
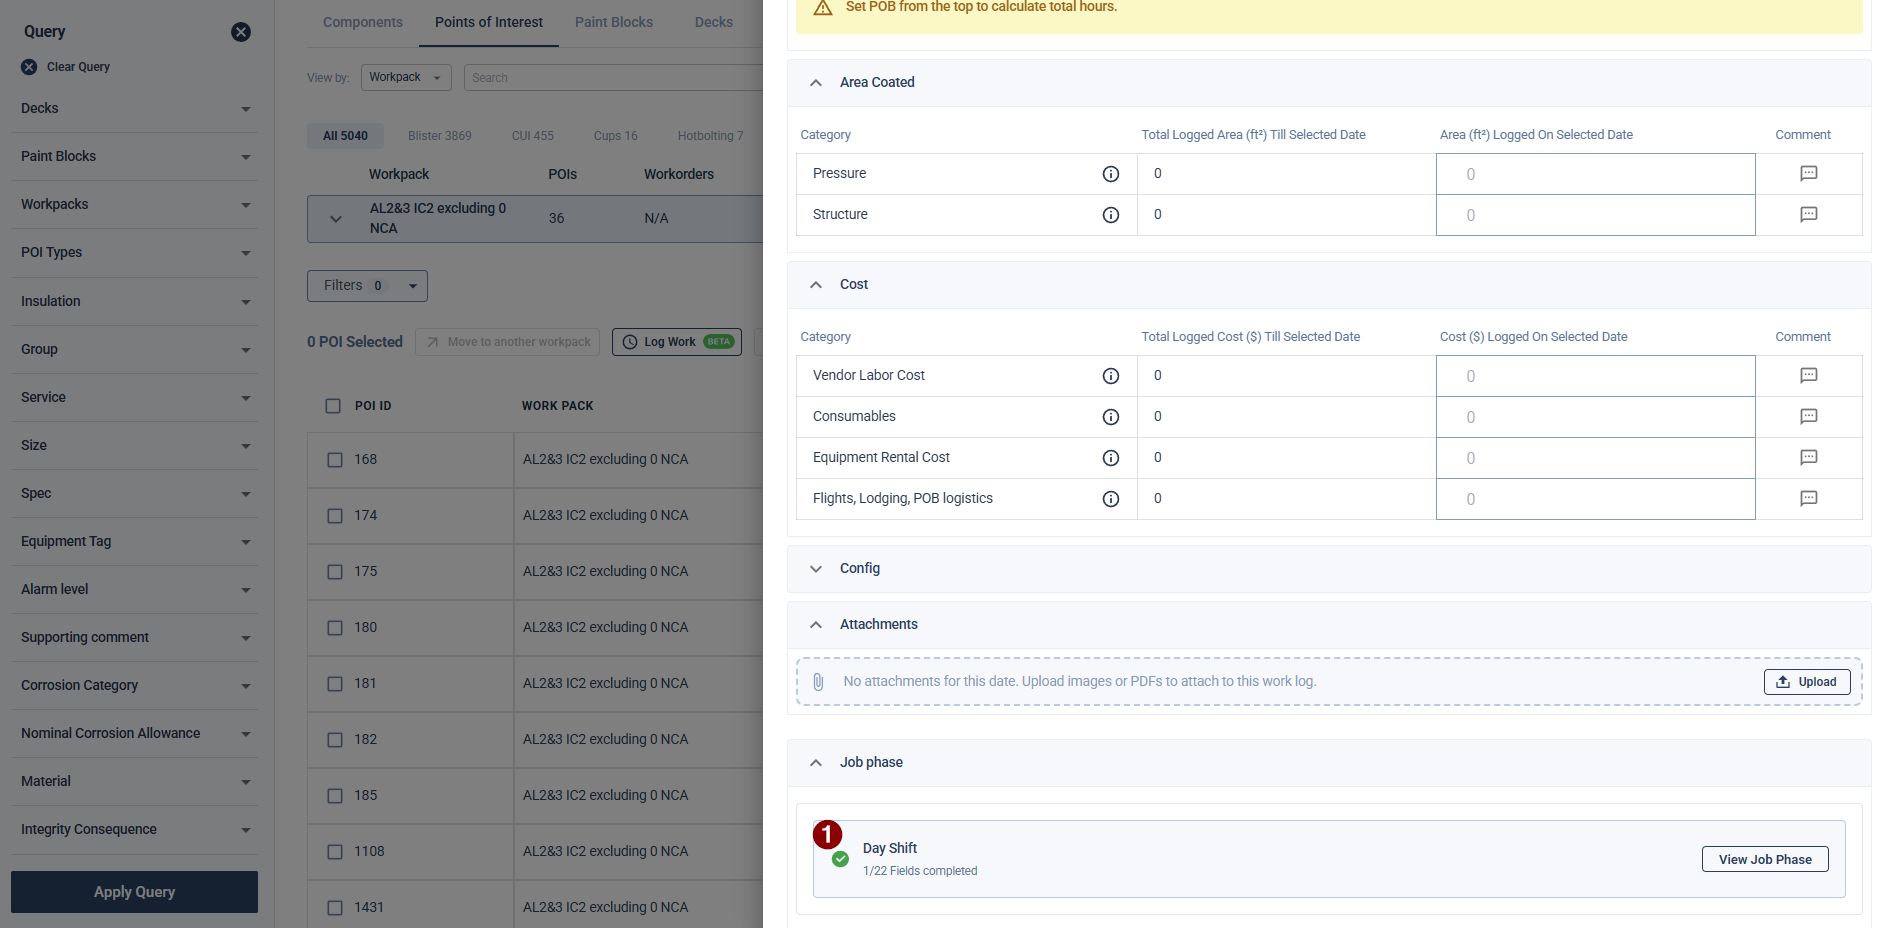
When you return to the main Log details screen, the section will now display a green checkmark indicating the form has been submitted for that shift.
4. Viewing and Editing Submitted Data
Once a form is submitted, the data can still be reviewed or updated if necessary.
To View:
Navigate to the Job phase section at the bottom of the Log details screen.
Click the View Job Phase button.
The form will open in a Read-Only state, allowing you to review all entered data without accidentally altering it.

To Edit:
While in the Read-Only view, scroll to the bottom and click the Edit Job Phase button.
The form fields will unlock. Make your necessary adjustments.
Click Save to apply your updates. A success message will confirm your changes.
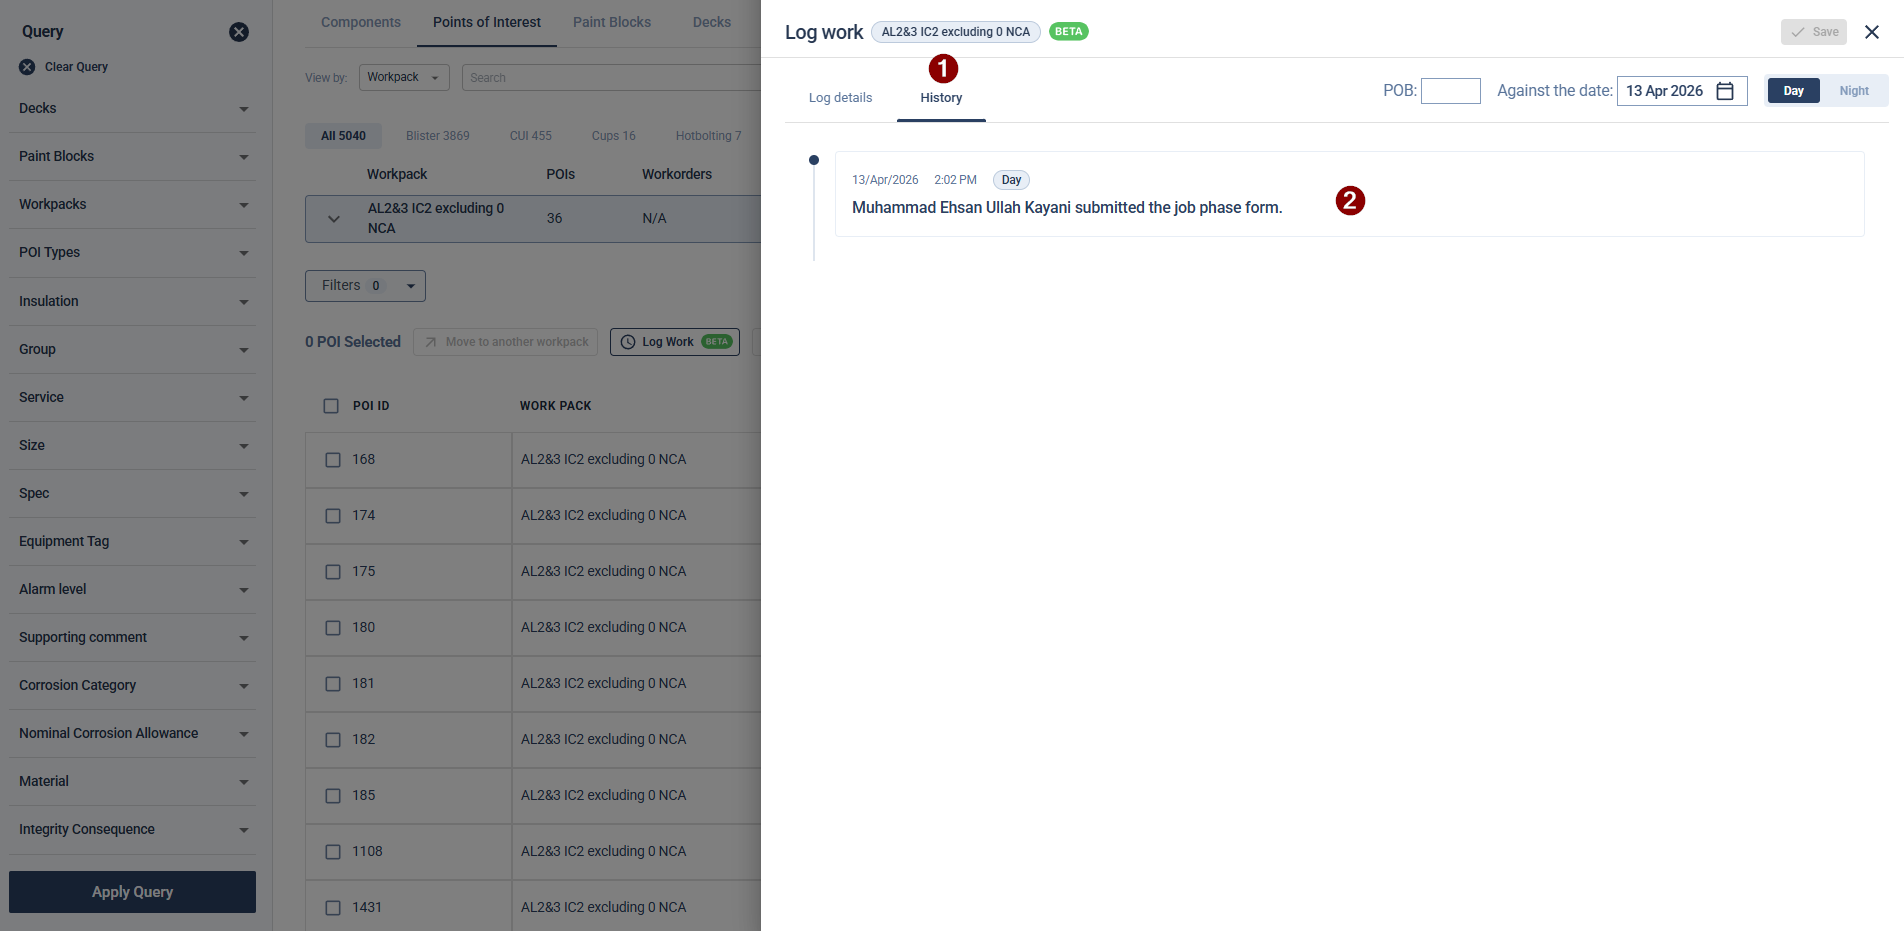
5. Tracking Submission History
To maintain accountability, the system automatically logs whenever a QA/QC form is submitted or updated.
On the Log Work screen, switch from the Log details tab to the History tab.
You will see a timestamped record detailing the date, time, shift, and the specific user who submitted or updated the Job Phase form.