Usage Guide
Sign In
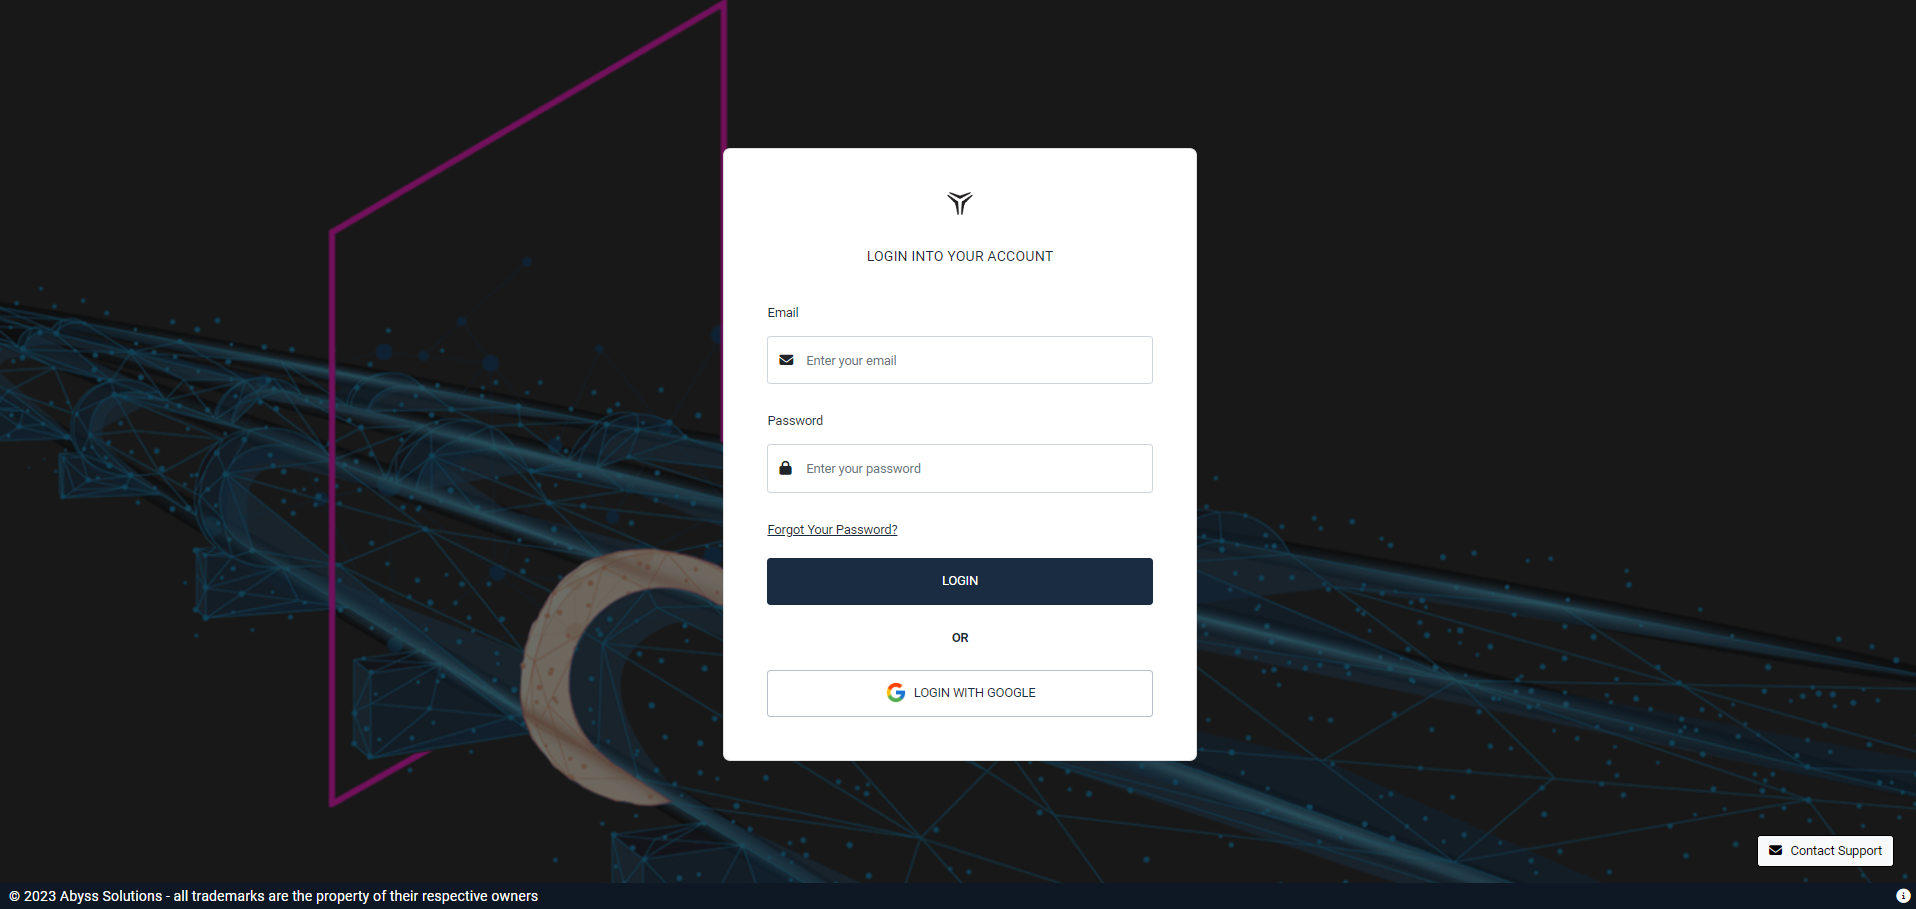
The respective Abyss Fabric access link will take you to the login page. Here, you will sign in with the login credentials that are created for you.
You can log in using your email address. Alternatively, if your organization has authenticated Google or Microsoft for login, you can use those credentials to log in to Abyss Fabric.
Forgot Your Password
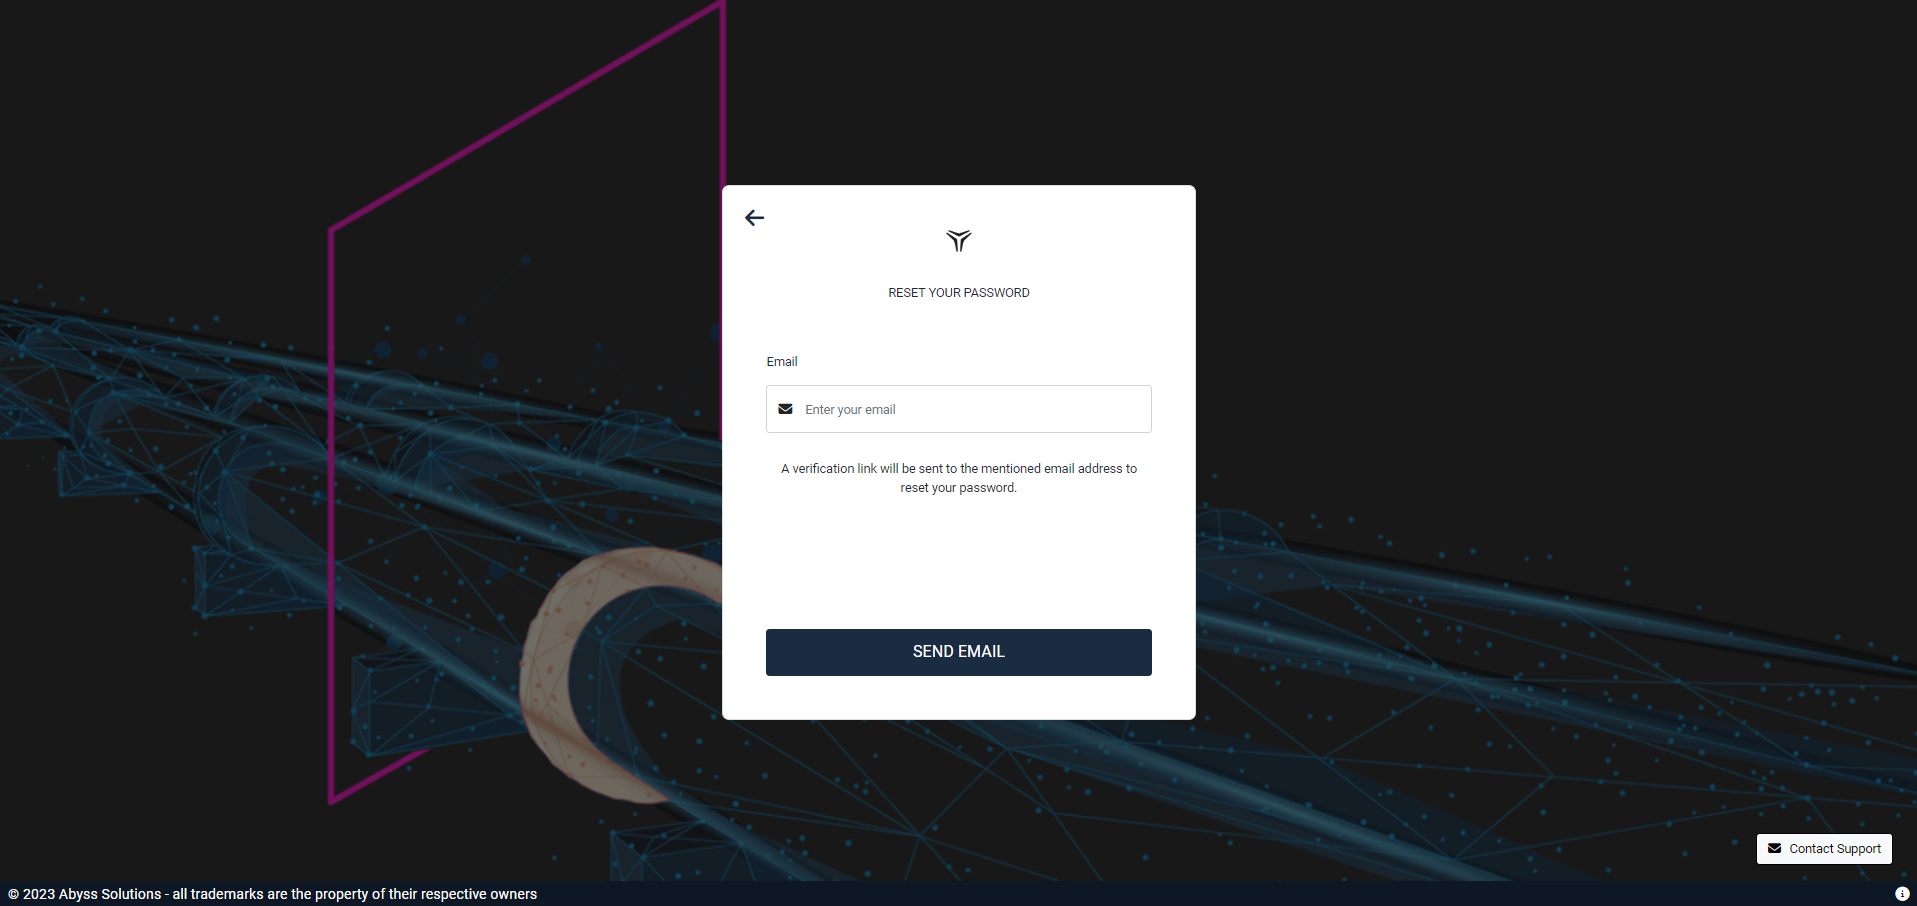
Forgot Your Password will take you to a page that will ask for the email associated with the login. Once the email has been added and the send email button has been pressed, an email will be generated and sent to the user's email address, allowing them to reset their password.
Platforms
Selection
On the home screen of the application, after logging in, you will find a page displaying all your accessible platforms.
The selection screen offers two options:
A drop-down list that displays the regions where the platforms are located. This allows you to filter and view the forms based on their respective regions.
The Search Box allows you to search for a platform by name.
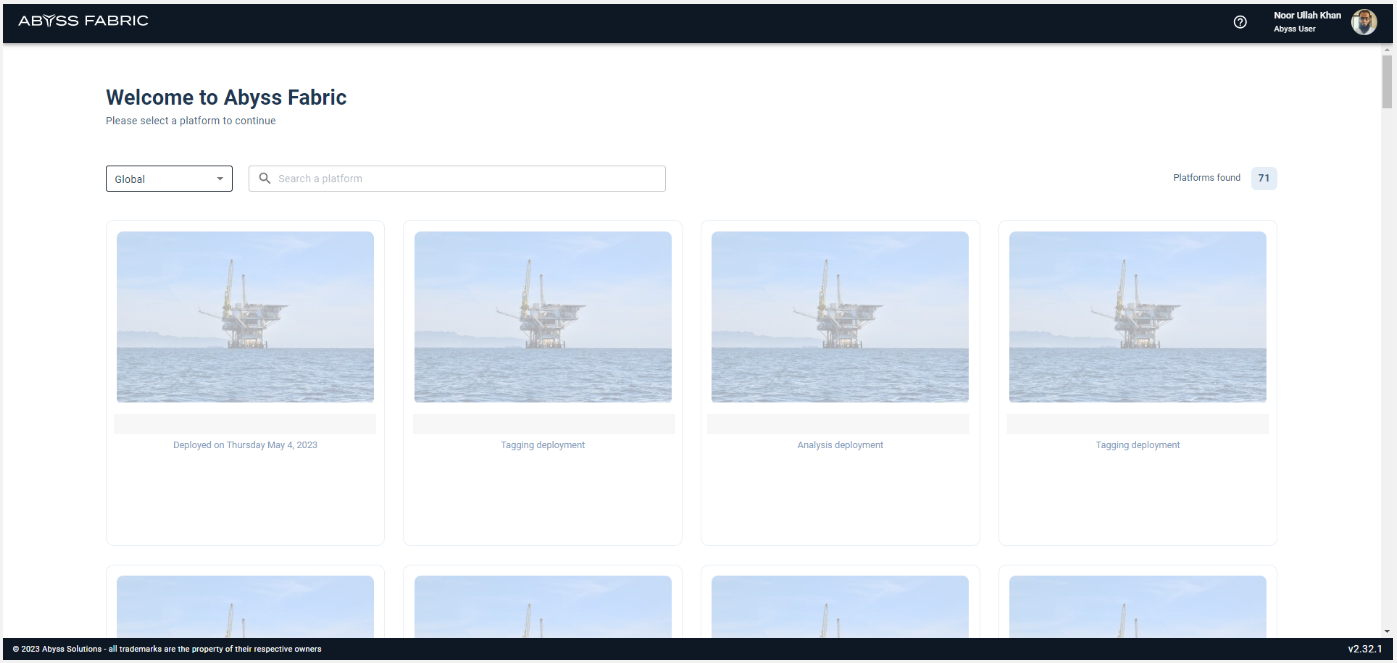
Each tile provides details regarding the following:
Name of the platform
The deployment date
A picture of the platform
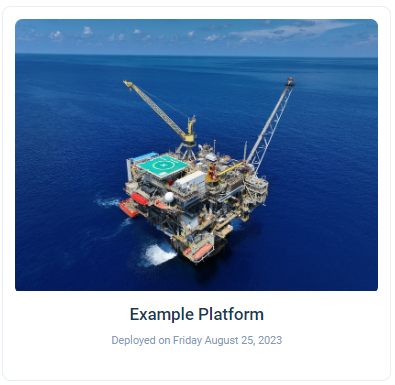
To access the platform, click anywhere on the tile.
Platform View
The Platform View has different sections that can be accessed using the top navigation bar.
There are four sections that you can access from the headings.
Insights
Viewer
Deck Plan
Reports

Insights
The Insights tab is divided into three sections:
Equipment
Points of Interest
Paint Block
Component
The Component page is where all the data and queries come together to provide meaningful insights into the platform. Users can access a dashboard to review all equipment and recorded data. By default, the Query Summary will be collapsed. Once the Query Summary is expanded, high-level details will be shown about the platform.
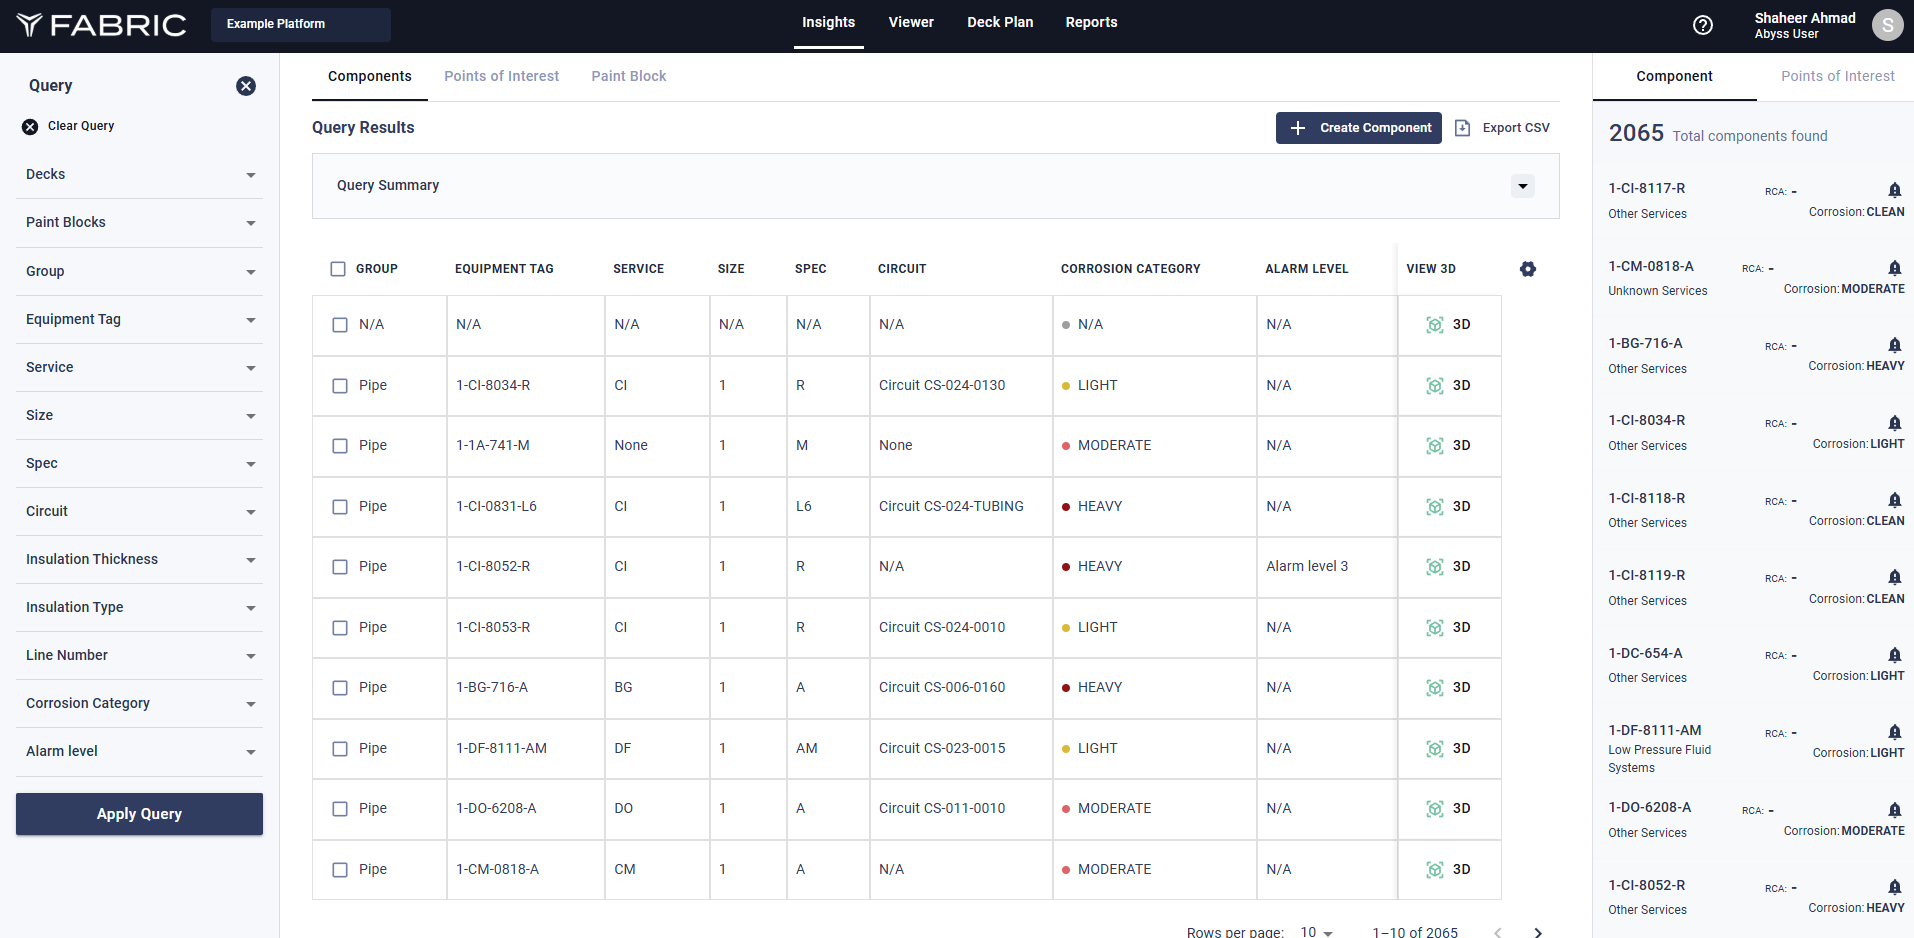
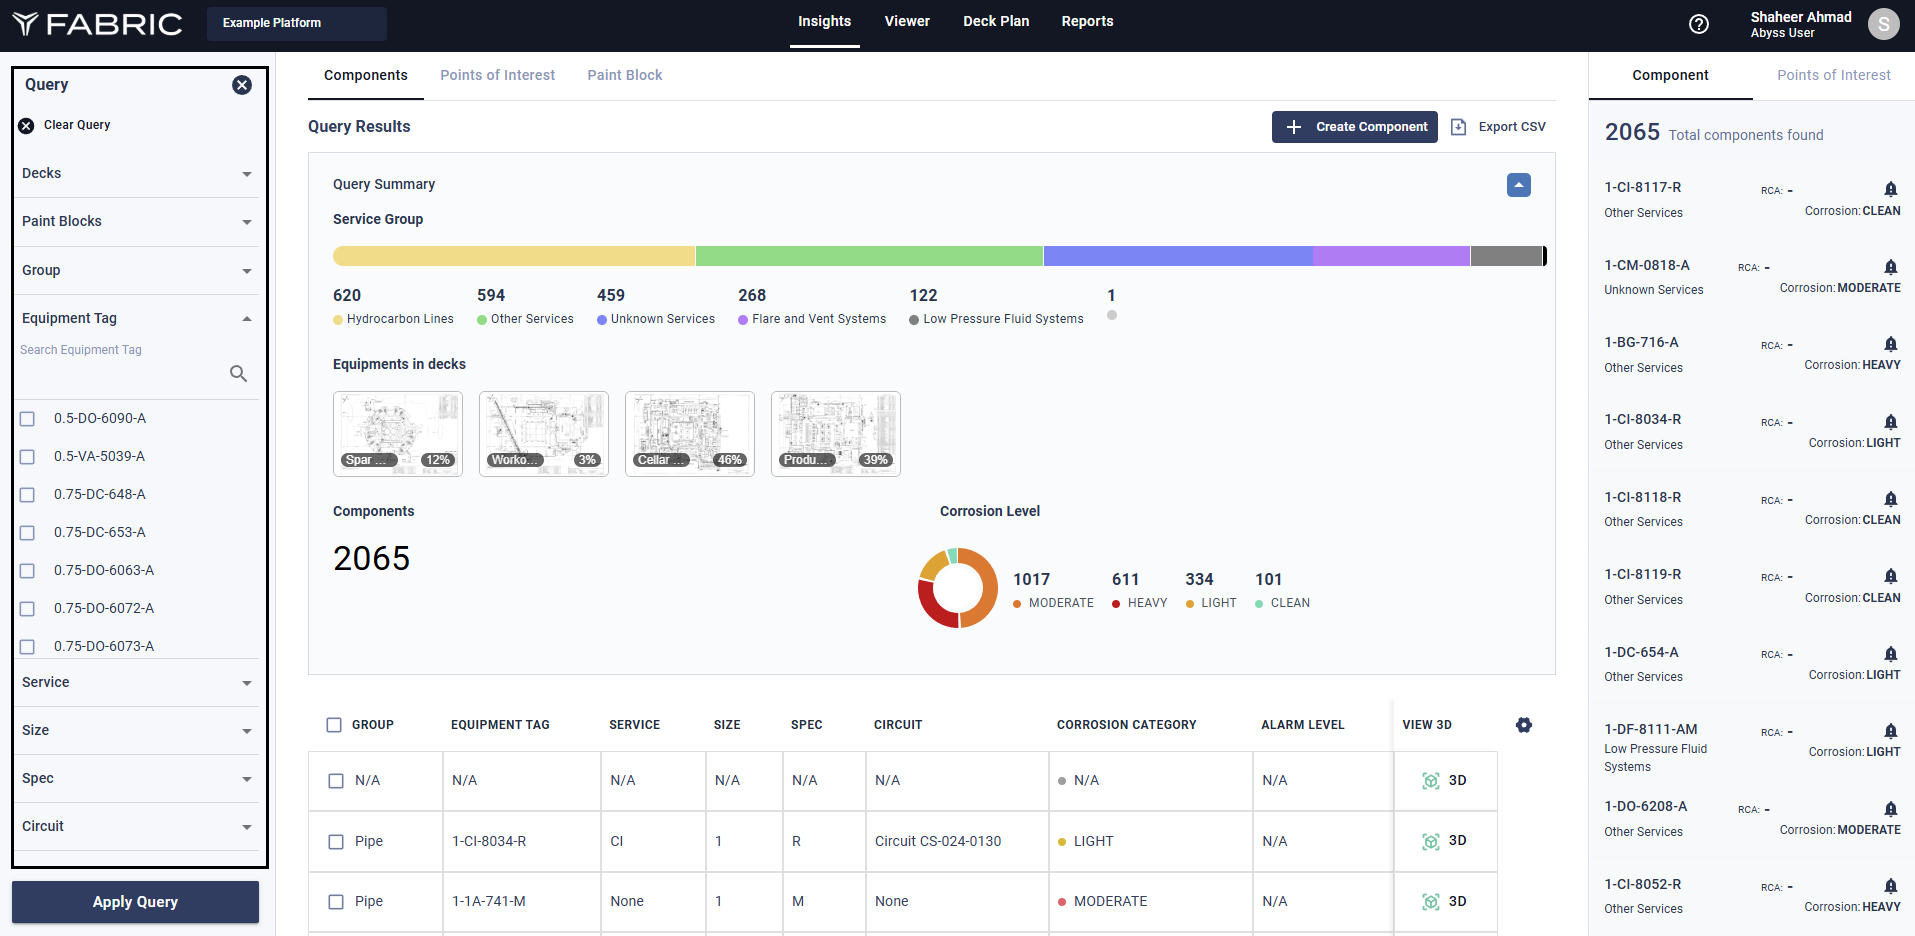
By default, no component is pre-selected and the right-side panel will not show any details. Only when the user clicks on a line in the table will the details of the selected component be populated in the right table, as shown below.
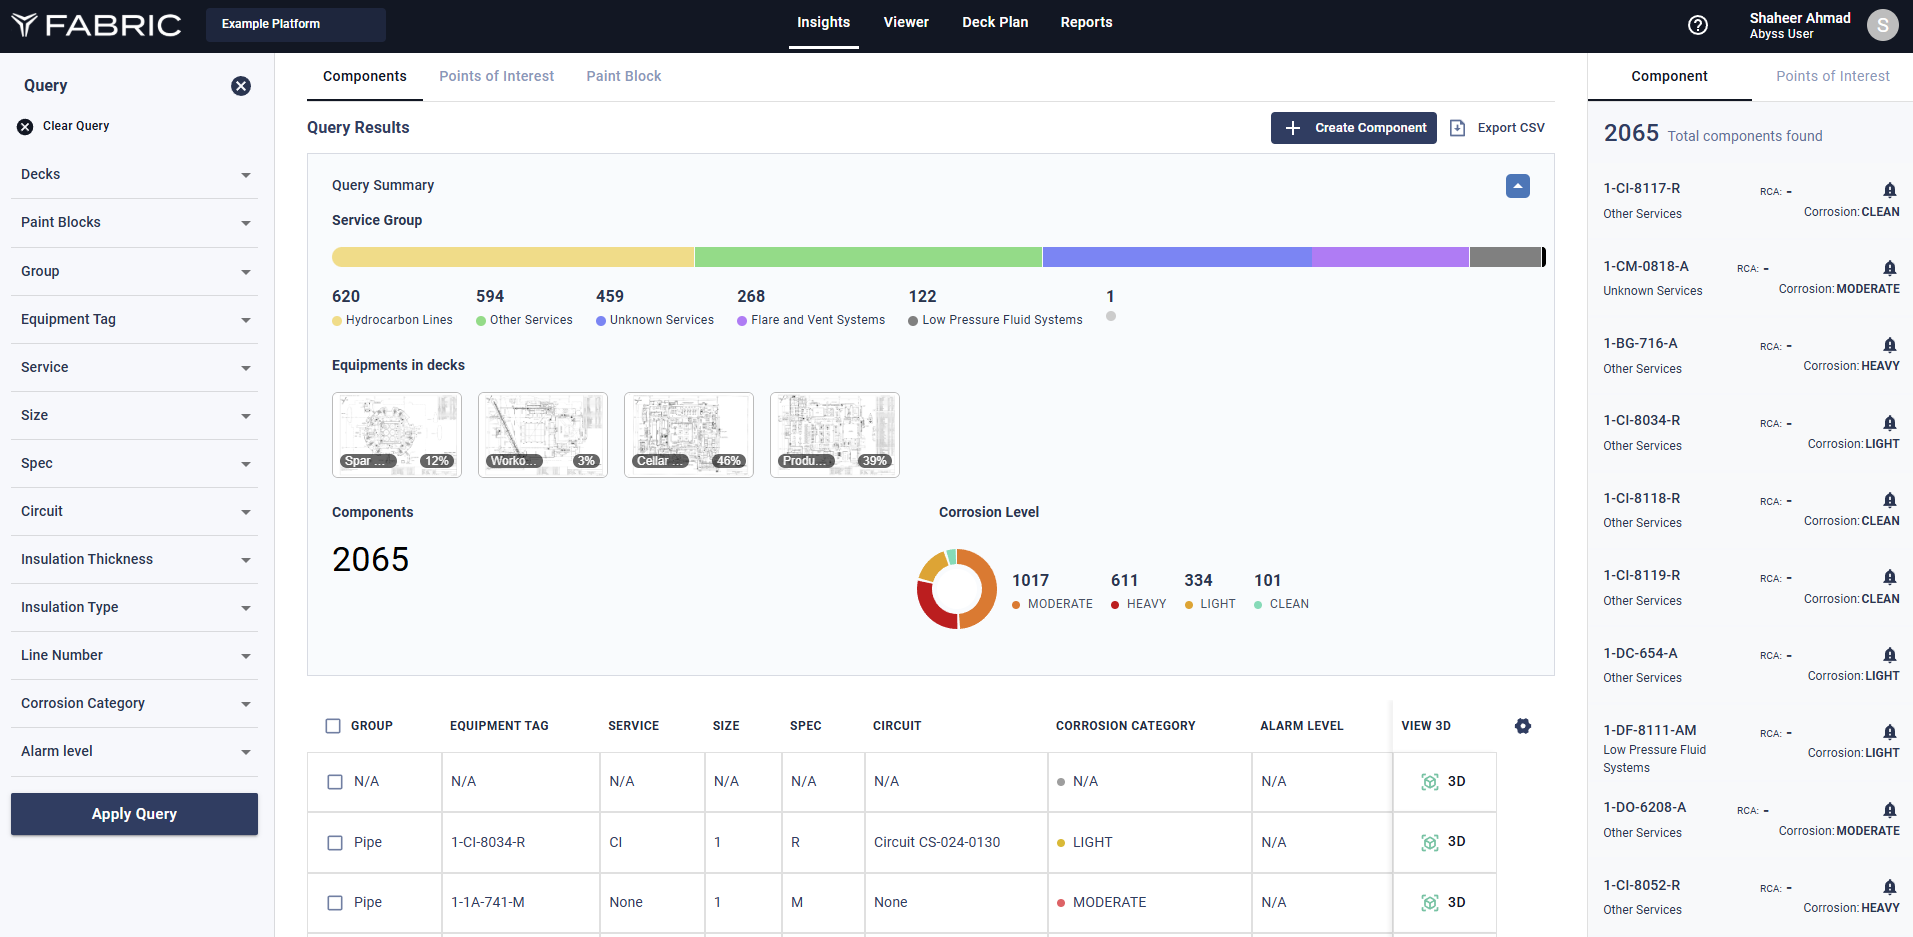
Query Summary
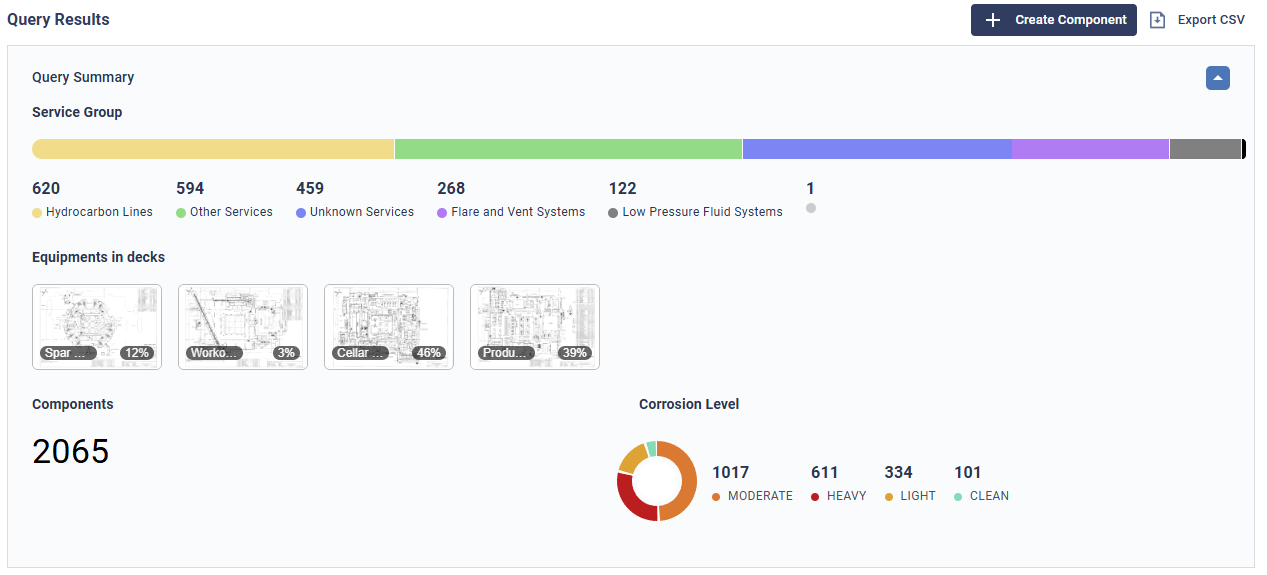
The Query Summary will display all the equipment in the selection. The selection can be a deck chosen from the decks shown above or any query from the left query panel. The selected equipment's details will be shown with a counter and pie chart indicating corrosion levels.
Selections can also be made from the Query panel on the left side of the page. Any details selected from the query will cause changes to both the summary and components accordingly.
Details Table
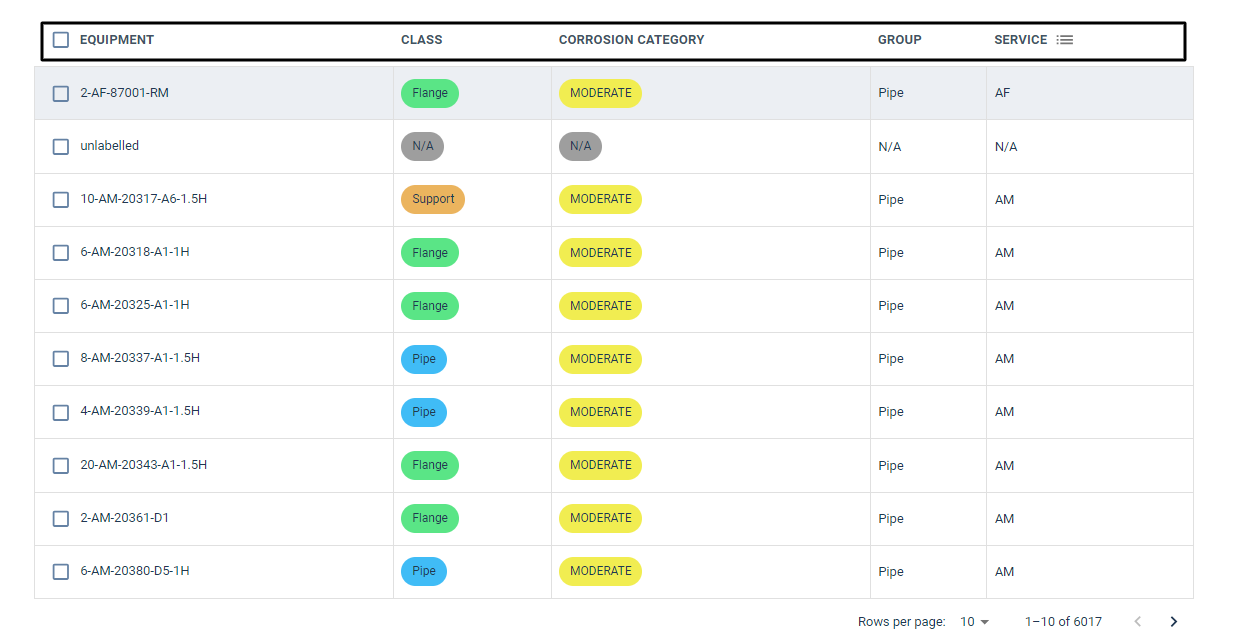
Following the component view, we have a list of all the component displayed in a tabular format; the table is updated based on the user's selection in the query area. The table can be sorted in ascending or descending order depending on the selected field. In this example, the data is sorted based on the corrosion field.
Key Definitions
These are the key definitions for each piece of equipment.
Component: The asset name (piping or vessel identification number) being inspected.
Group: Grouping of components as Pipe or Vessel.
Service: The operational service the component is designed for (e.g., Cooling Water, Hydrocarbon).
Size: The dia of the component displayed in mm or inches.
Spec: The pipe specification assigned to the component as defined in the piping material document.
Equipment Tag: A unique identification tag assigned to the component. Same as Component.
Alarm Level: The severity level assigned based on the component’s condition (Alarm Level 1 or 2 or 3)
Supporting Comment: Notes provided to support alarm level assignment.
Additional Comments: General remarks or supplementary information related to the component.
Assembly Area: The total surface area of the component assembly in m2 or ft2 as seen by the scanner.
AC-L: Area of the component affected by light corrosion in m2 or ft2 .
AC-M: Area of the component affected by moderate corrosion in m2 or ft2.
AC-H: Area of the component affected by heavy corrosion in m2 or ft2.
Ri1: Corrosion area in the range (0.05%, 0.5%]. Shows the area affected in this corrosion category.
Ri2: Corrosion area in the range (0.5%, 1%]. Shows the area affected in this corrosion category.
Ri3: Corrosion area in the range (1%, 8%]. Shows the area affected in this corrosion category.
Ri4: Corrosion area in the range (8%, 40%]. Shows the area affected in this corrosion category.
Ri5: Corrosion area in the range (40%, 100%]. Shows the area affected in this corrosion category.
Corrosion Area: The total surface area of the component affected by corrosion in m2 or ft2.
Corrosion Ratio: The ratio of the corroded area to the total component area.
Consolidated Degree of Rusting: Overall rust severity derived from individual rust indices.
Substrate Condition: The highest of the available corrosion on any selected component. It can be Clean, Light, Moderate or Heavy.
Corrosion Category: The corrosion severity classification (Clean, Light, Moderate, Heavy).
Decks: The deck or structural level where the component is located.
Paint Blocks: Defined coating or paint application zones on the component.
Points of Interests: The count and types of anomalies identified on the component.
Insulation: Indicates whether the component has no insulation, partial insulation, or full insulation.
Max Blister Height: Maximum height of a blister or depth of a pit on the component (in mm or inches).
Governing Blister URL: Link to the point of interest (POI) representing the governing blister.
Governing Blister Link: Opens the 3D viewer to the governing blister side tab.
Governing Defect Type: Type of defect present, either blister or pit.
Wall Loss (WL): Reduction in component wall thickness, calculated as MBH/X or Pit Depth.
Residual Corrosion Allowance (RCA): Remaining corrosion allowance after accounting for estimated wall loss (RCA = NCA − WL).
Residual Thickness (RT): Remaining nominal thickness after estimated wall loss (RT = NT − EWL).
Residual Thickness Percentage (%RT): Remaining thickness expressed as a percentage of estimated wall loss (%RT = (NT − EWL)/EWL).
Criticality: Component criticality level (e.g., HES Critical, Non-Critical, Critical), as defined by the client via IDMS.
Pressure Category: Component pressure classification (e.g., Unknown, High, Low, Medium), as defined by the client via IDMS.
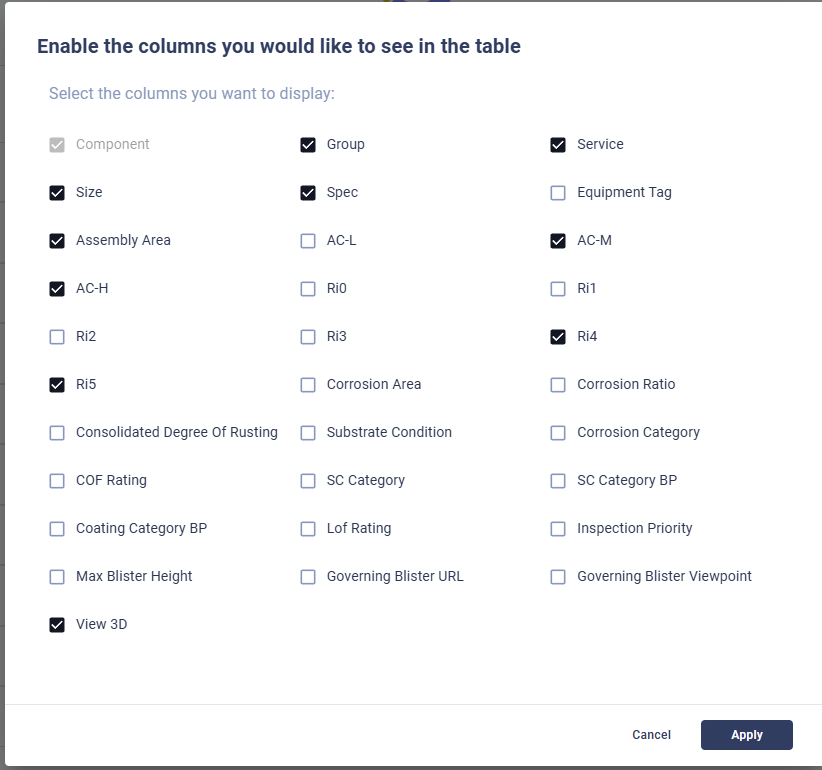
Furthermore, the table also has a selection of the columns available, this enables the viewer to view their respective data with flexibility. This may vary from platform to platform and is dependent on the data that is available for processing.
Using the Query
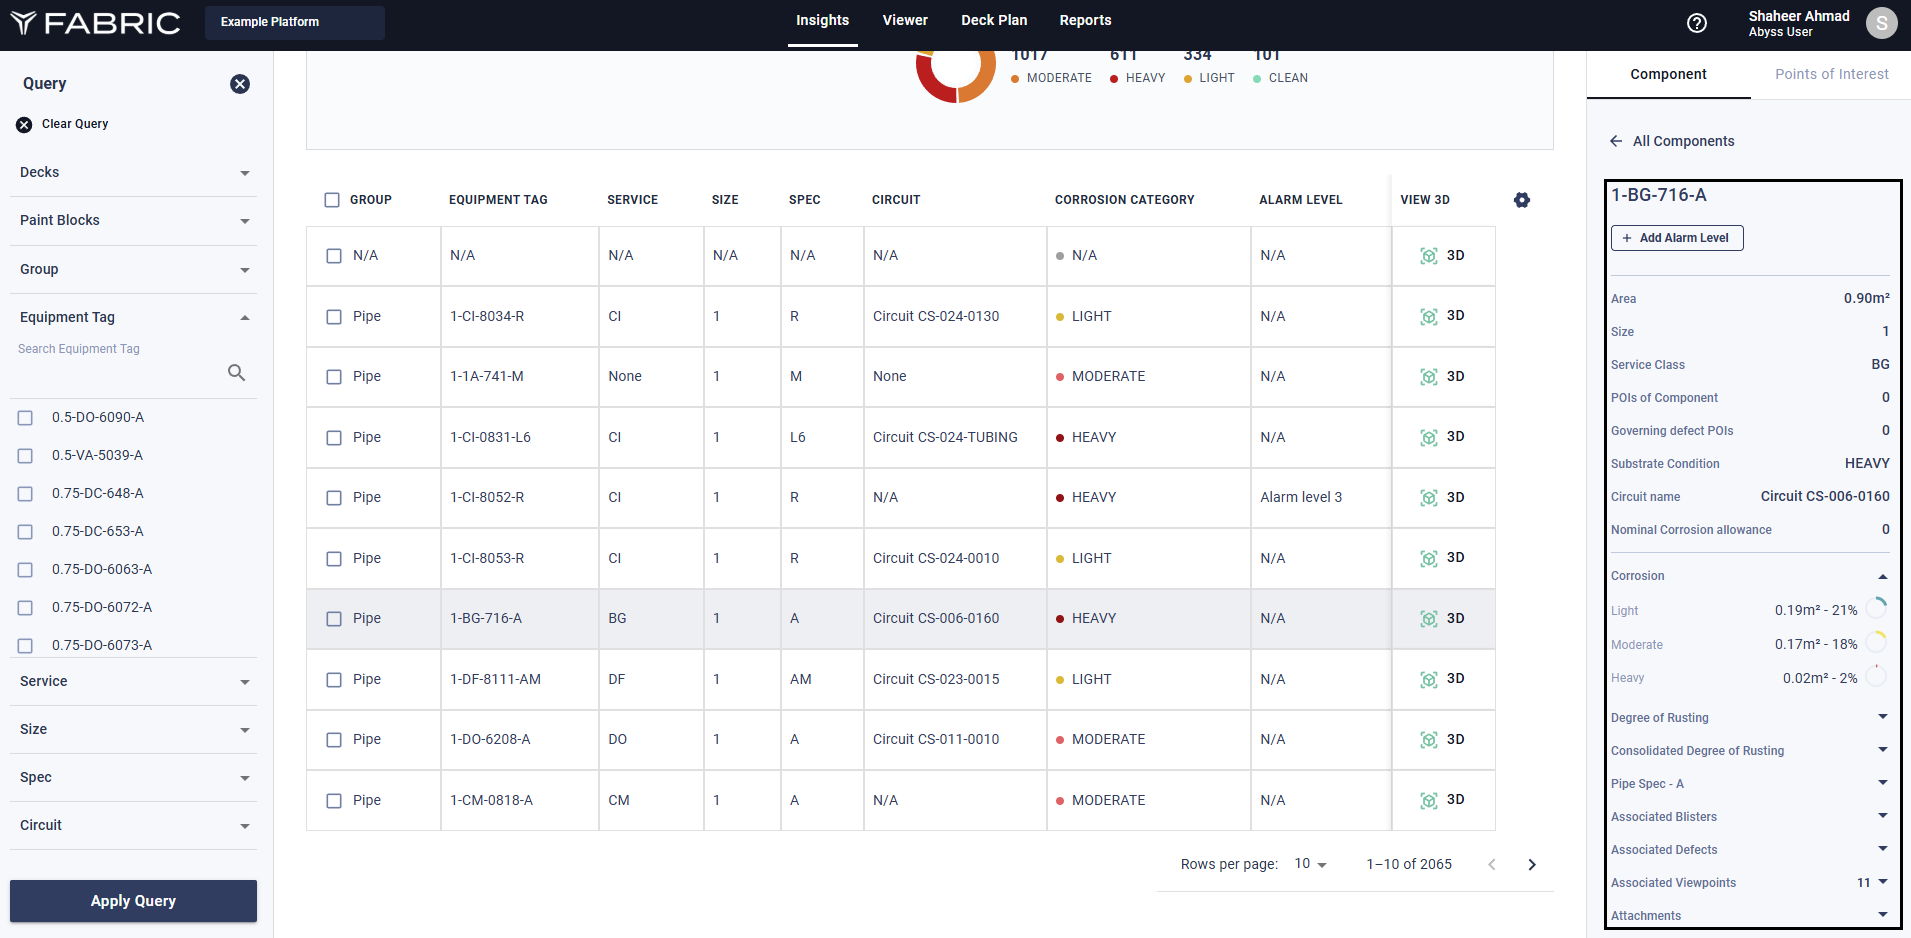
When the user selects a particular piece of equipment the detail of the equipment is shown in the equipment panel. The details that are shown in the equipment panel are Class, Corrosion Category, Group, Service, Size, Spec, Inspection Priority, and Line Number.
Corrosion is shown in detail and the breakup of corrosion with respect to light, moderate, and heavy corrosion.
Number of Rows
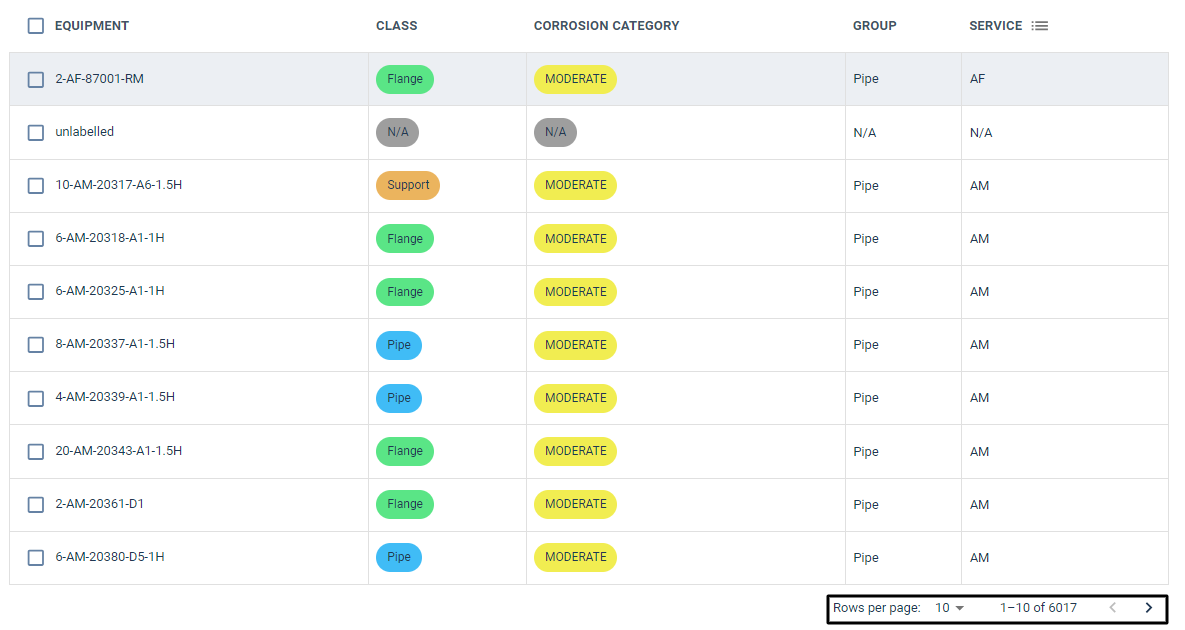
The number of displayed rows on the table can be edited by using the dropdown at the bottom of the table.
Sorting & Ranking Your Results
If you want to organize your results based on specific criteria, you can use the sorting and ranking feature. To do this, simply click on one of the table headers. Please note that this feature only works for Equipment, Corrosion, and Class metrics.
Points of Interest
This tab contains a tabular view of all the different types of Points of Interest that have been recorded throughout the platform. If a user wants to focus on the details of Hotbolting, they can click on that tab below the Point of Interest heading. This will highlight that tab and below you will see a listing of relevant points of interest.

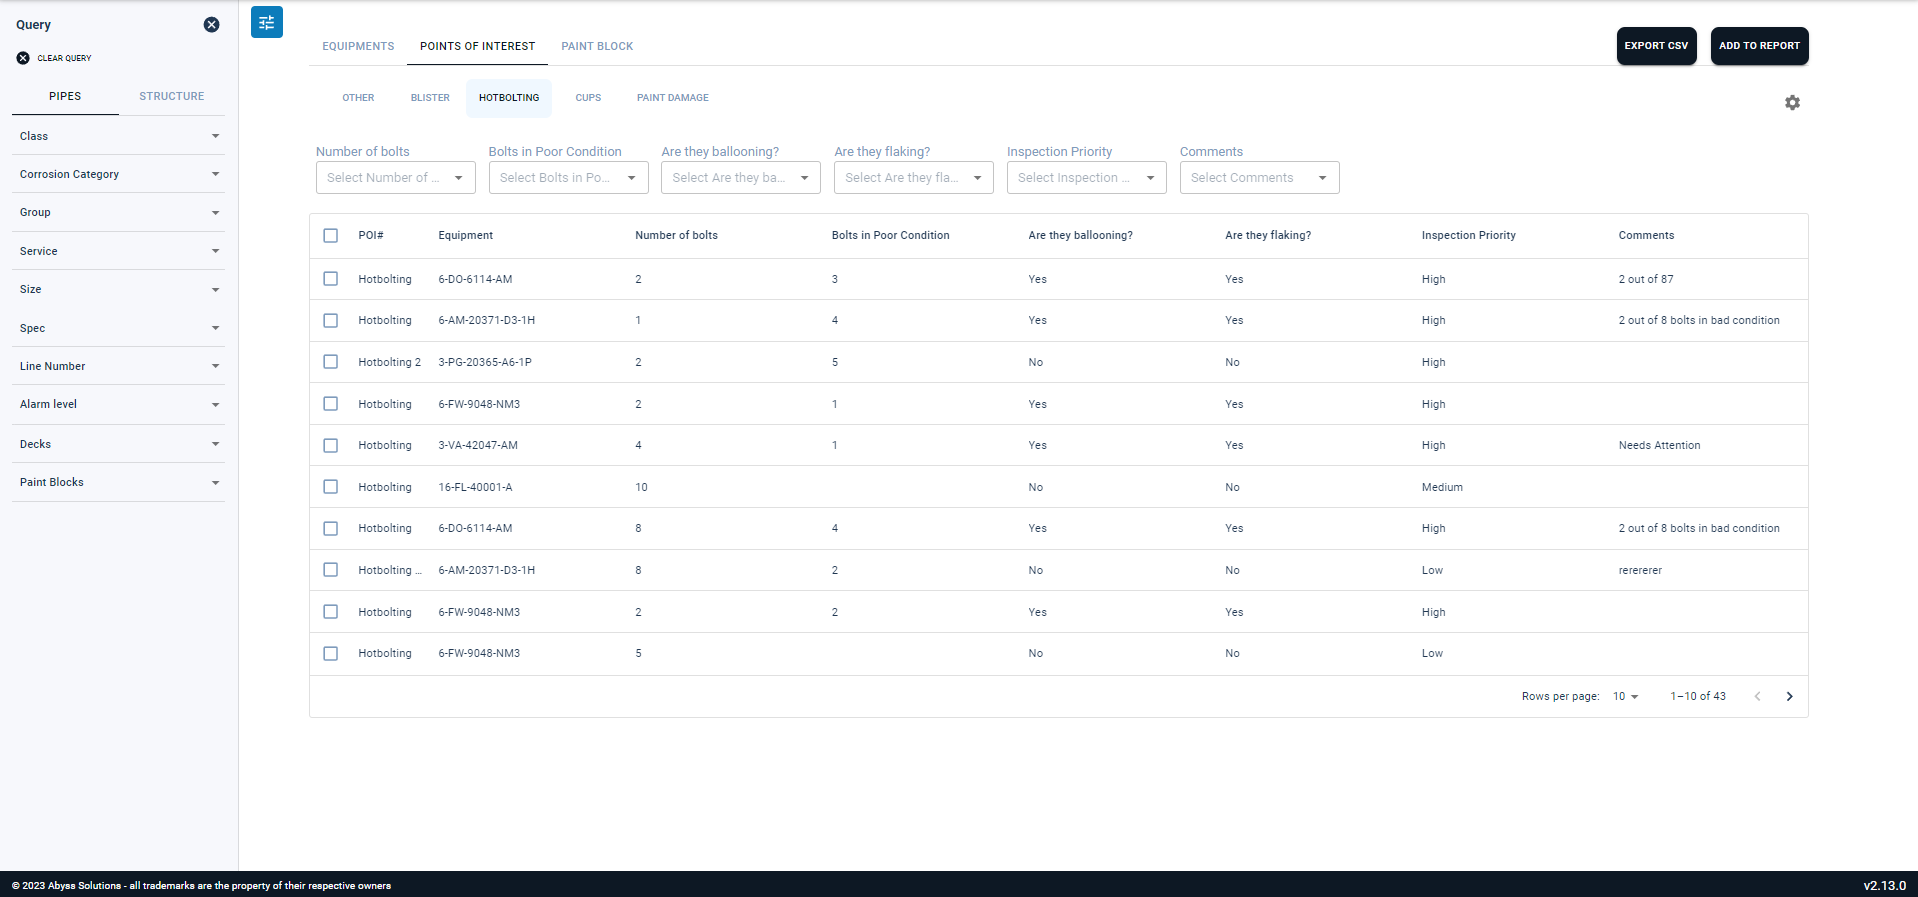
In the table you can see rows of all Points of Interest of a single type and all the data that has been associated with it which was saved while recording that particular point of interest.
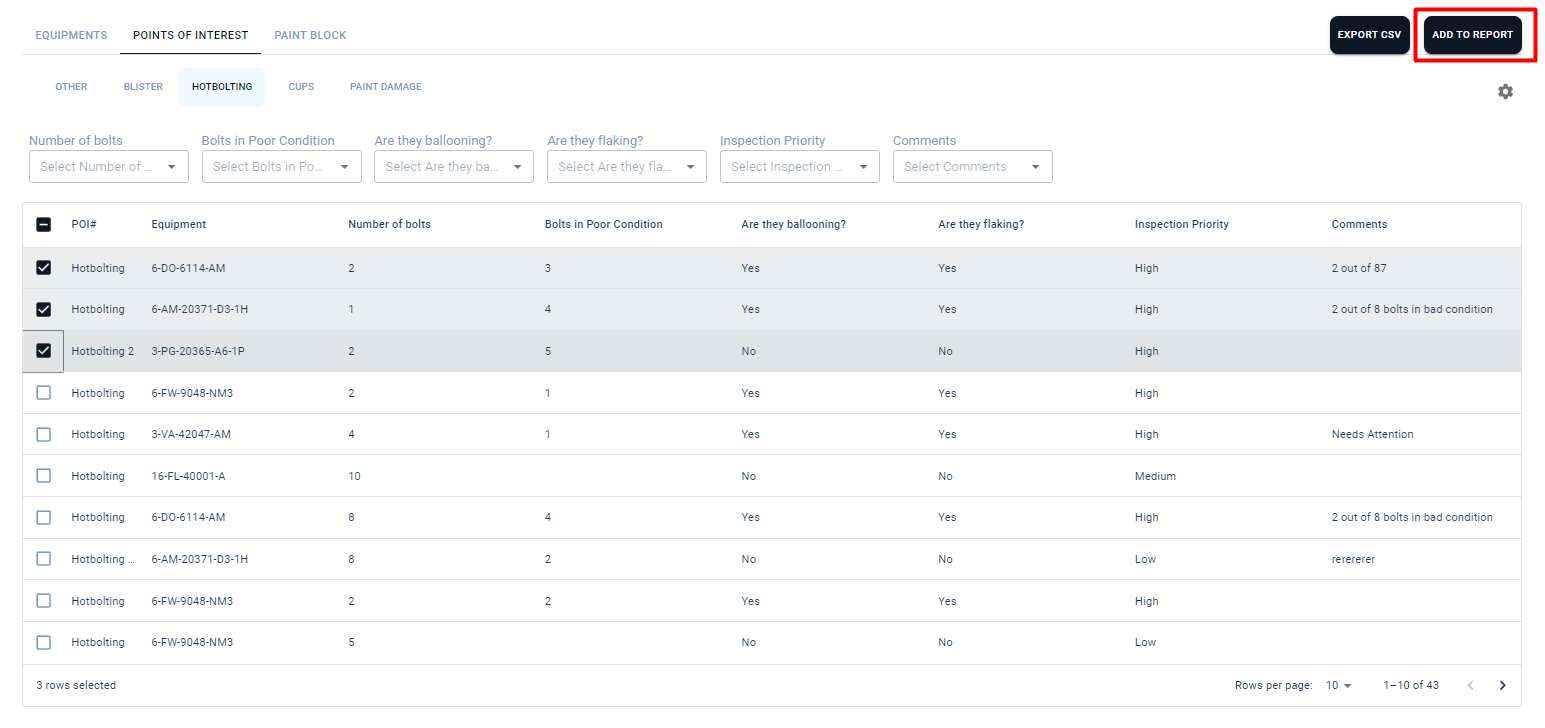
A report of selected points of interest from this table can also be made by clicking on the checkboxes.
Filters
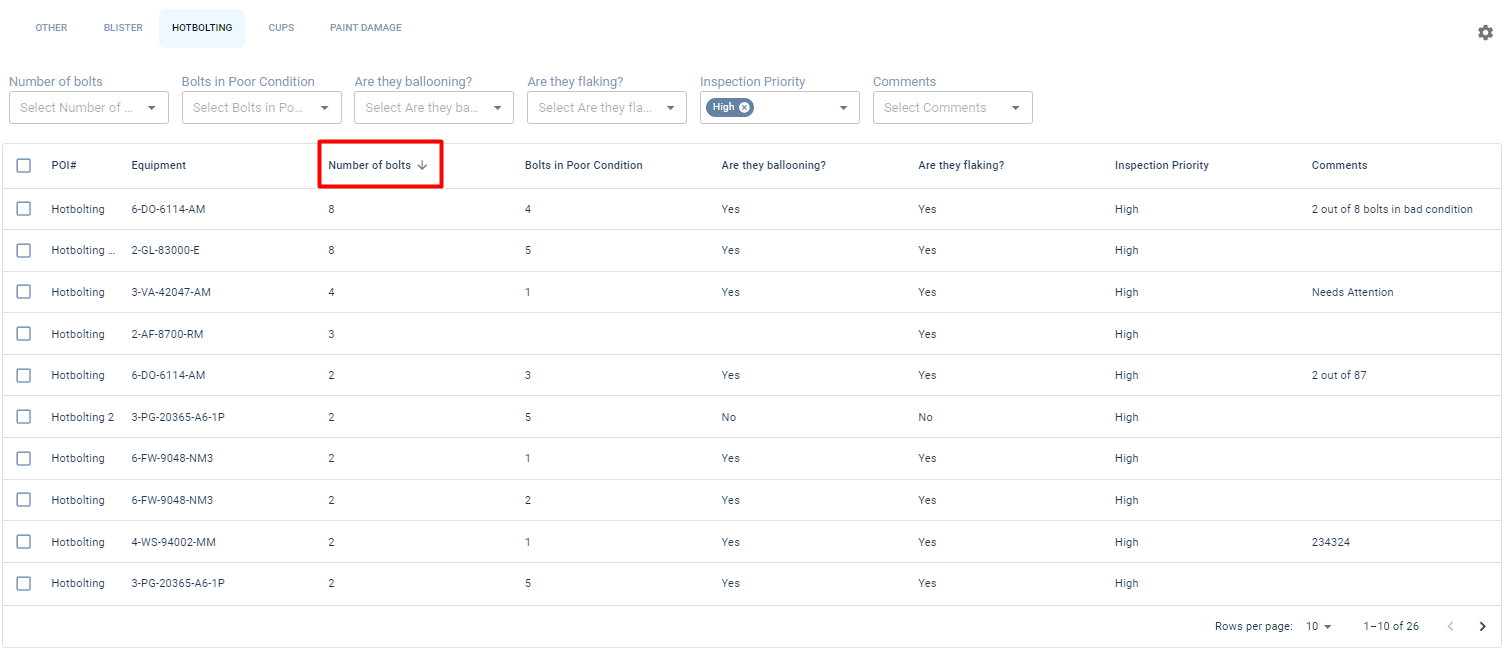
All the fields that are present in a Point of Interest type can be filtered as well. For example, in the case of a Hotbolting Point of Interest, a user adds inspection priority and a number of bolts. These fields appear as filters on top of the table. In the image below you can see filters associated with Hotbolting and what happens when a filter is applied.

In the image below, the user will observe that after the application of a High filter in Inspection Priority, all instances with High value are filtered out. Additionally, values in tables can also be sorted in ascending or descending order based on user requirements. At the bottom of the table, you can observe how many instances match this criteria.
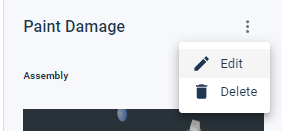
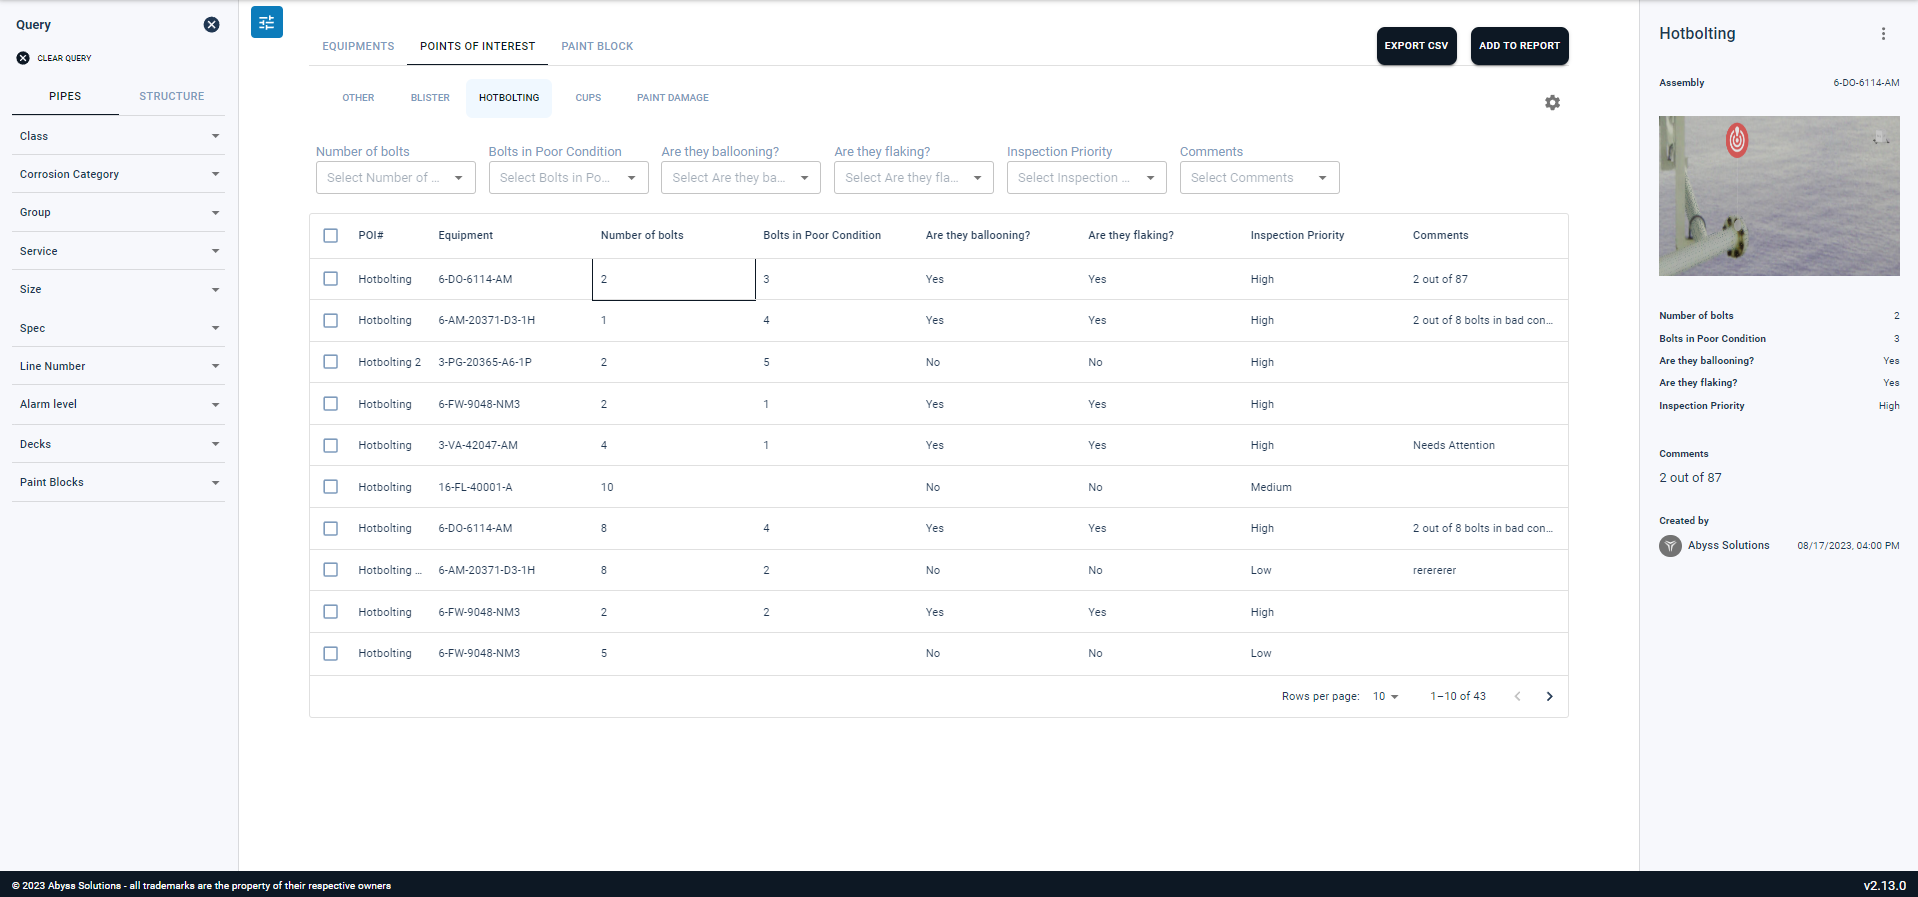
Clicking on a row in the table opens a side panel that contains the image and information of the selected point of interest. Additionally, if any information needs to be edited, it can be done from the side panel.
Export Data
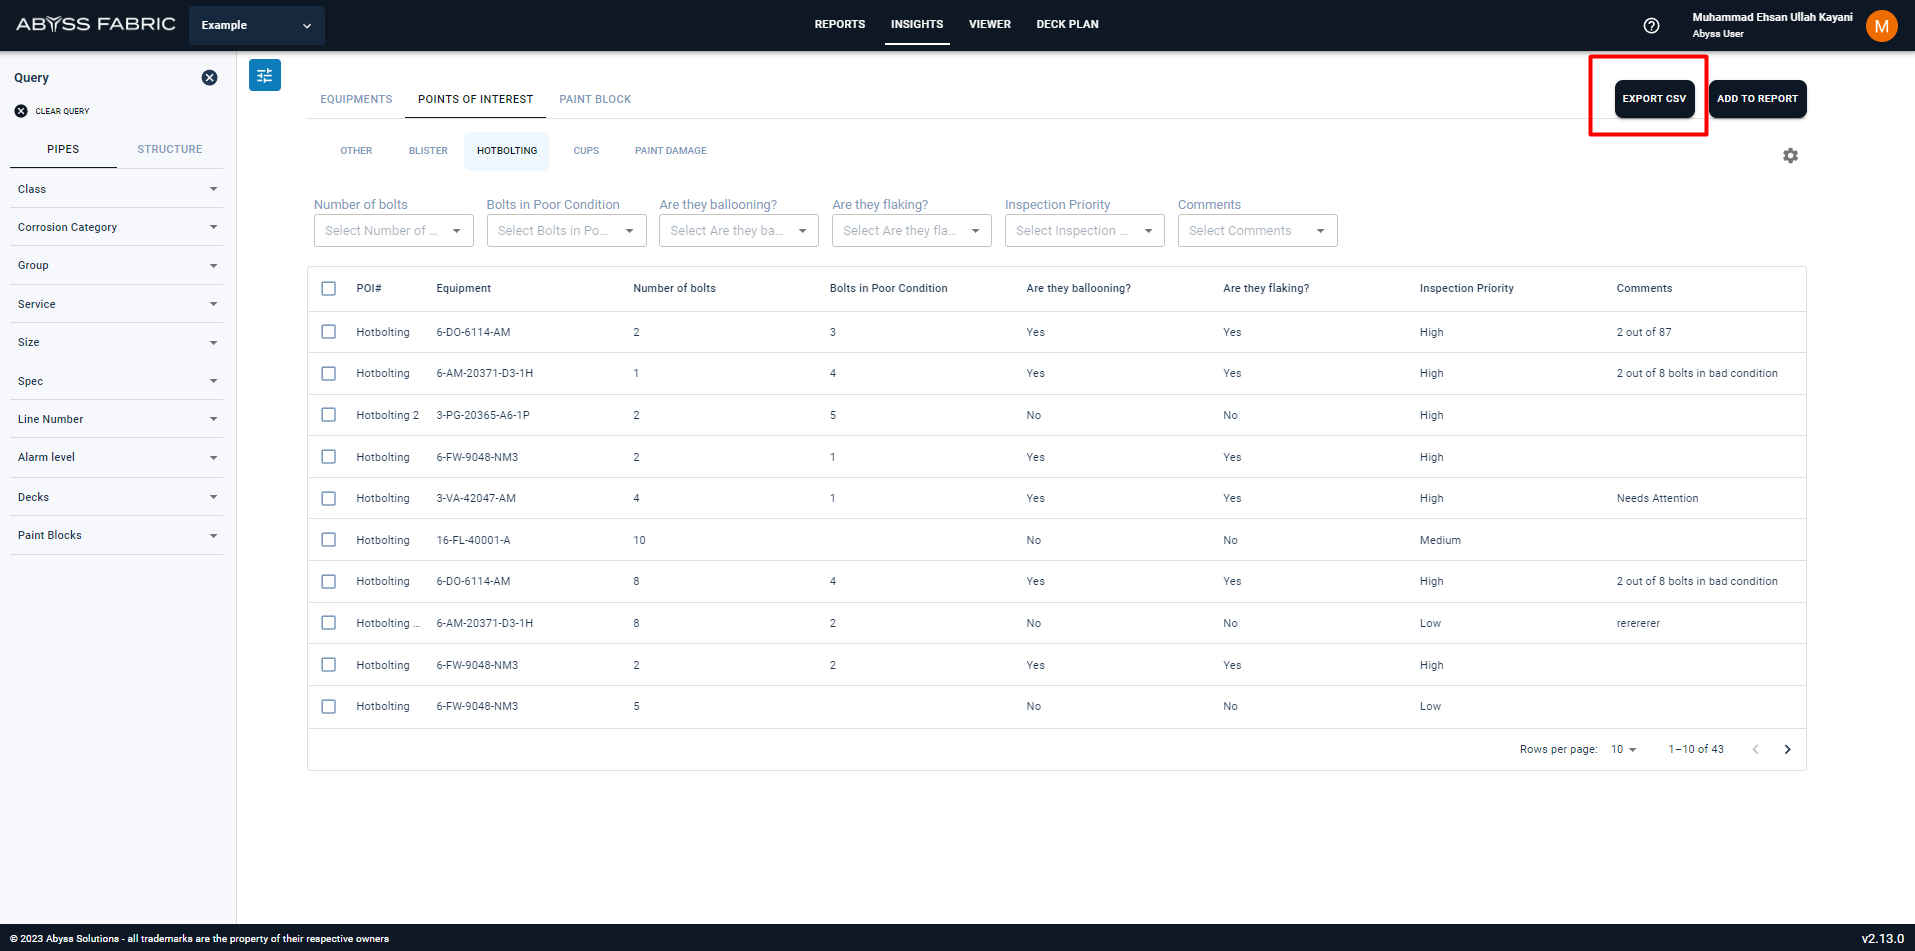
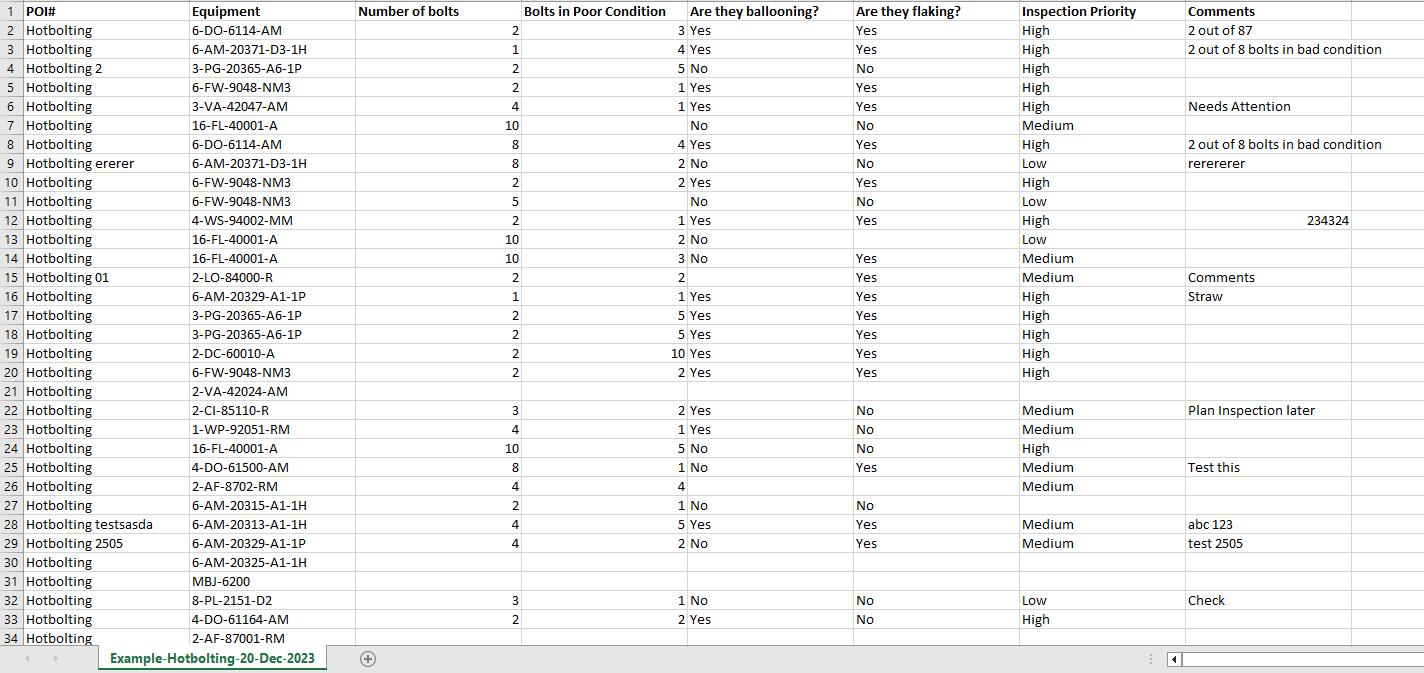
Each table data can be exported as a CSV for offline data manipulation.
Paint Block
This tab provides information at the paint block level.
Summary / Charts
There are two main graphs which show descending values from left to right. This panel can be collapsed or expanded.
Finding Counts per Deck and per Paint Block: This displays the number of findings that are present in a particular deck or a paint block.

Coating Condition per Deck and per Paint Block: This contains total corroded area that is present in a particular deck or a paint block.

The graphs provide high customization on the deck level. If a user wants to visualize the graph of decks of their own choice instead of all, the decks can be selected or deselected from the panel below the graphs. In a similar fashion, this will also shortlist paint block according to the deck selection.
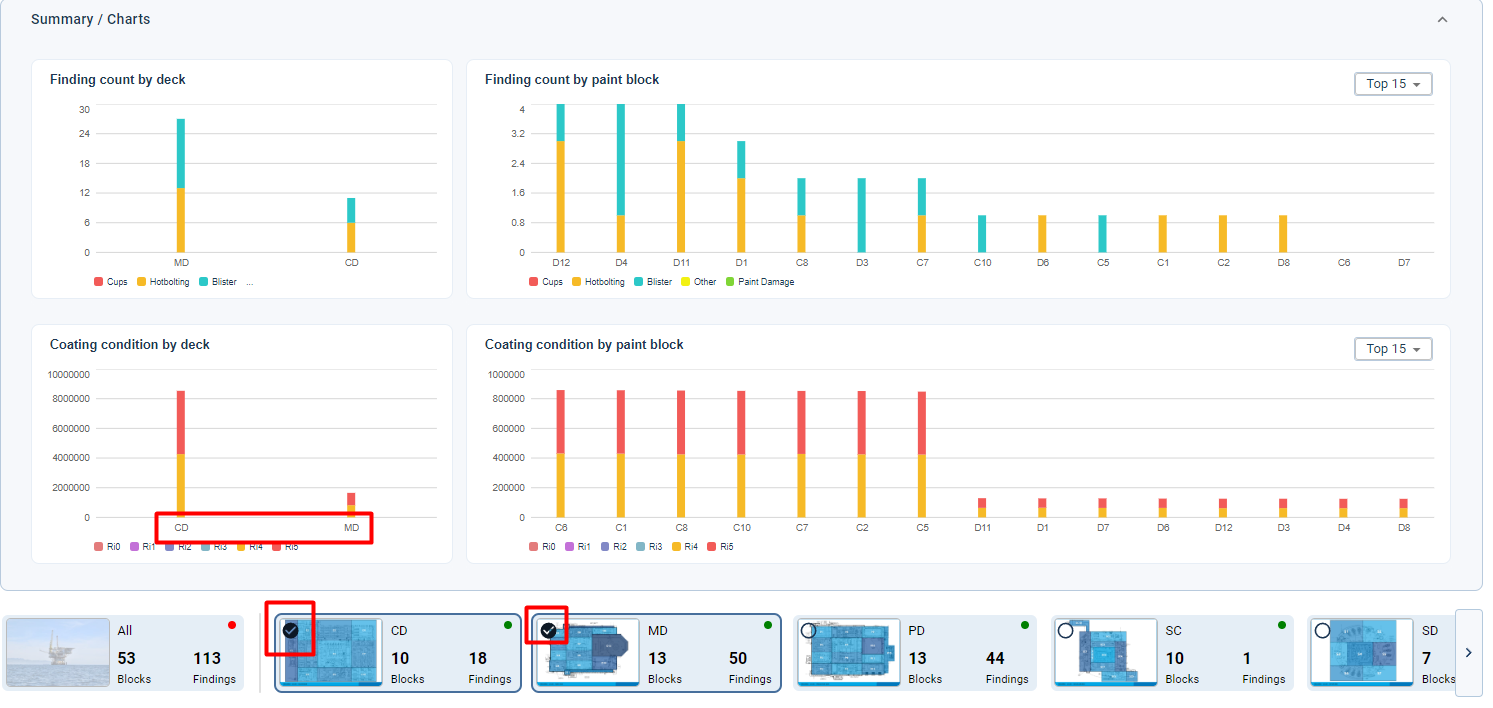
The checkboxes further help the user decide what they consider as findings. They can select and deselect Blister, Hotbolting, Cups, etc. to include in graphs. For coating condition graphs, the checkboxes allow users to include Ri0 to Ri5 data in graphs. The legend for findings and coating condition is mentioned below the graphs.
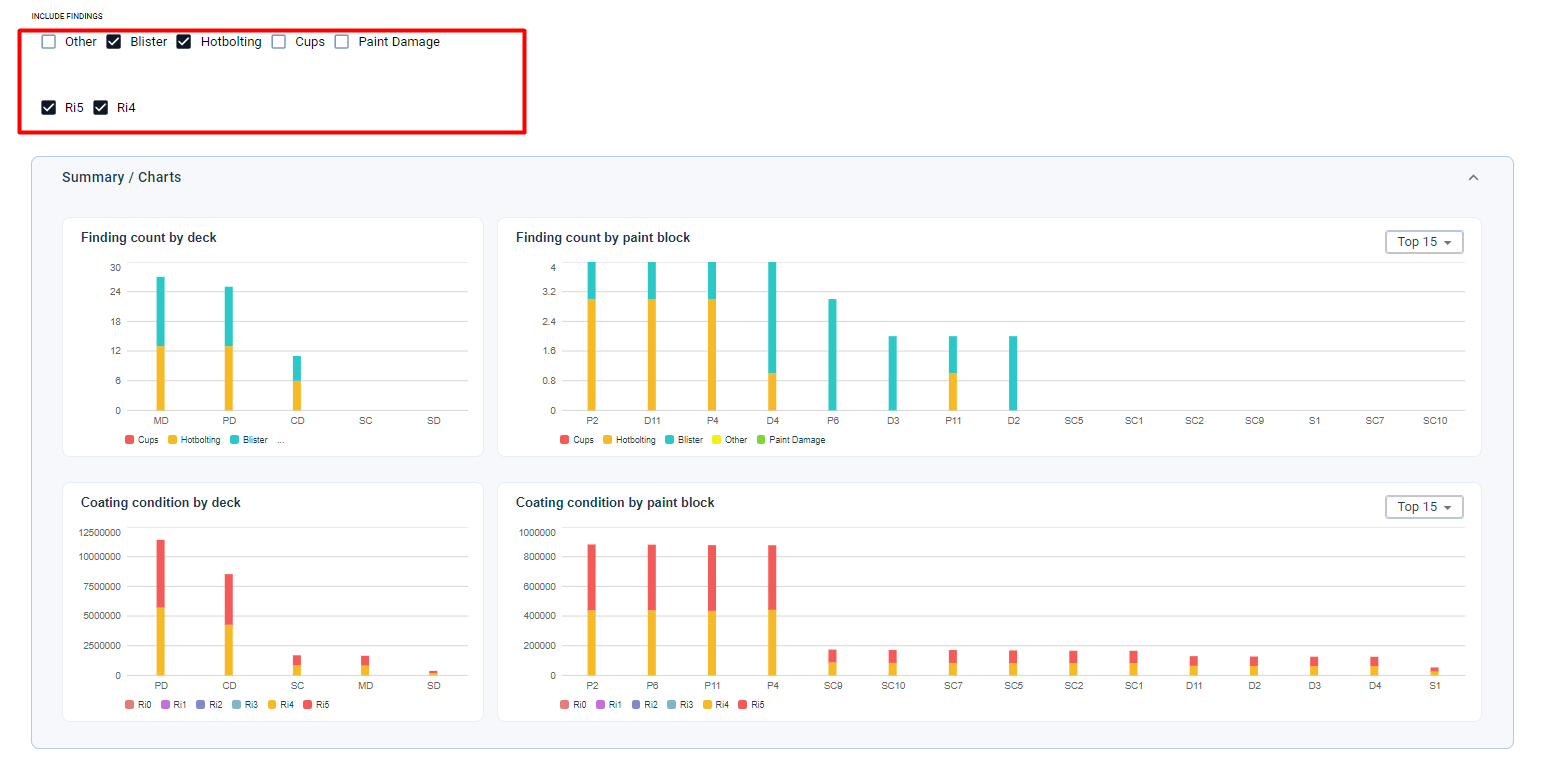
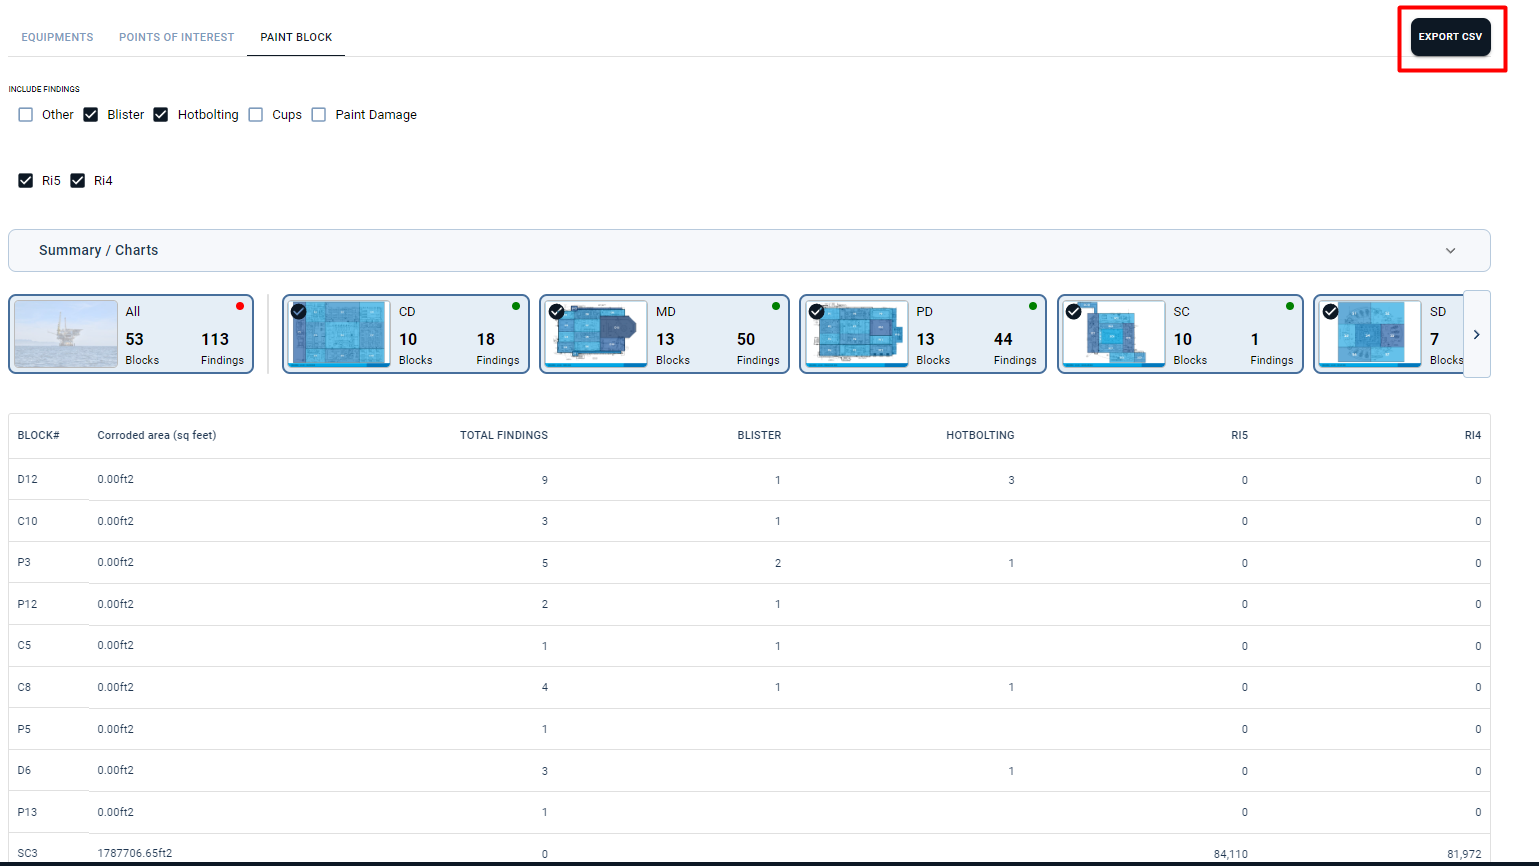
Table View
All the data that is present in graphs is also present in a tabular view which can filtered.

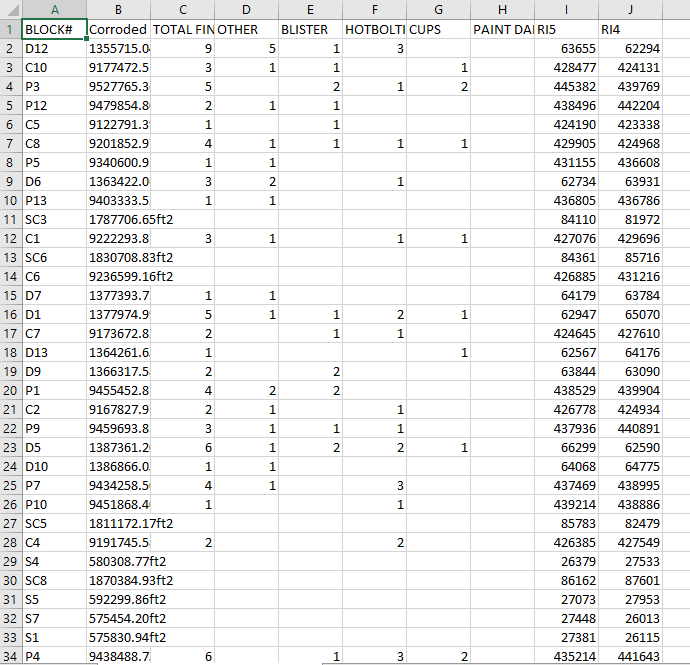
Export Data
Table data can be exported as a CSV for offline data manipulation.
Viewer
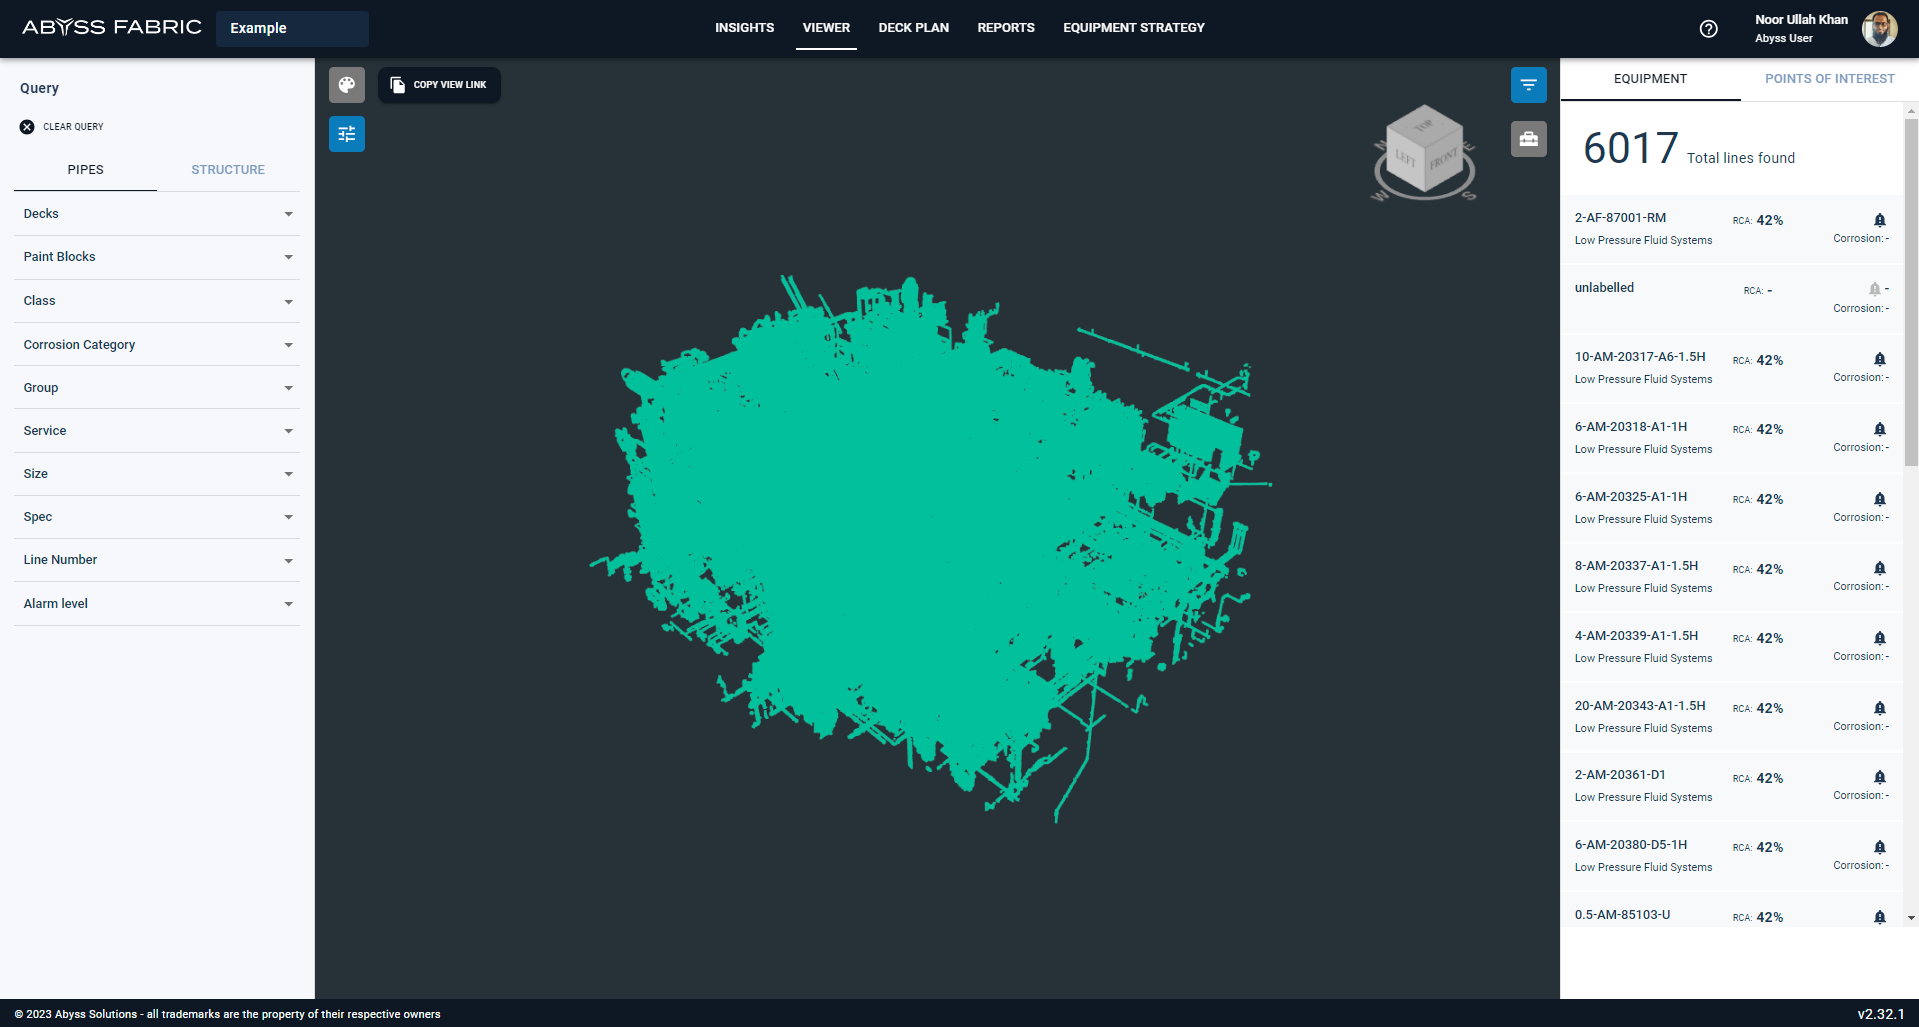
Upon accessing the platform, users are presented with a viewer page showcasing a comprehensive 3D point cloud representation of the entire platform.
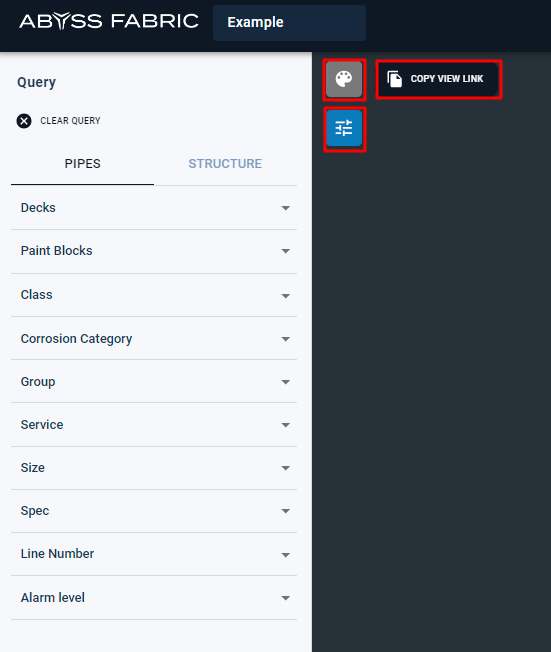
On the left side, two buttons pull the panel drawer they can both be closed as well. The two buttons are
Visibility Settings
Query
A copy view link that will copy the current link for the 3D Point Cloud viewer
Visibility Settings
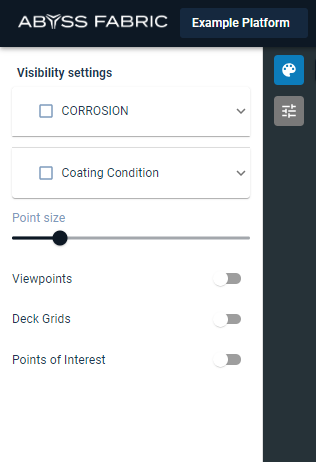
This panel has the following options:
Corrosion
This highlights the corrosion areas on the equipment that's selected
Coating Condition
This highlights the coating condition areas on the equipment that's selected
Either Corrosion or the Coating Condition may be selected at one time
Point Size
This is a numbered scale to increase the size of the point cloud shown on each piece of equipment
Viewpoint
Viewpoints are the points from where the scans for the platform were conducted, this option shows all the viewpoints on the 3D point cloud
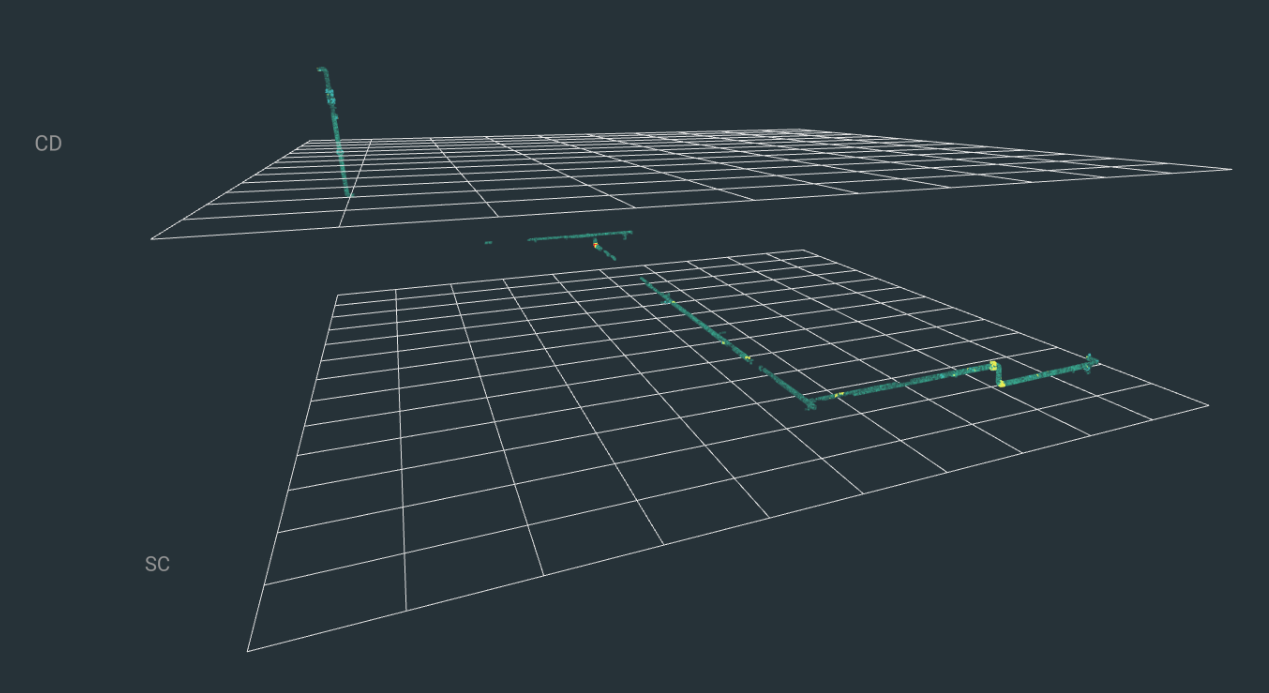
Deck Grids
This option is accessible when a single piece of equipment is selected, the Deck Grids will create a mesh that splits the platform in the respective Decks available
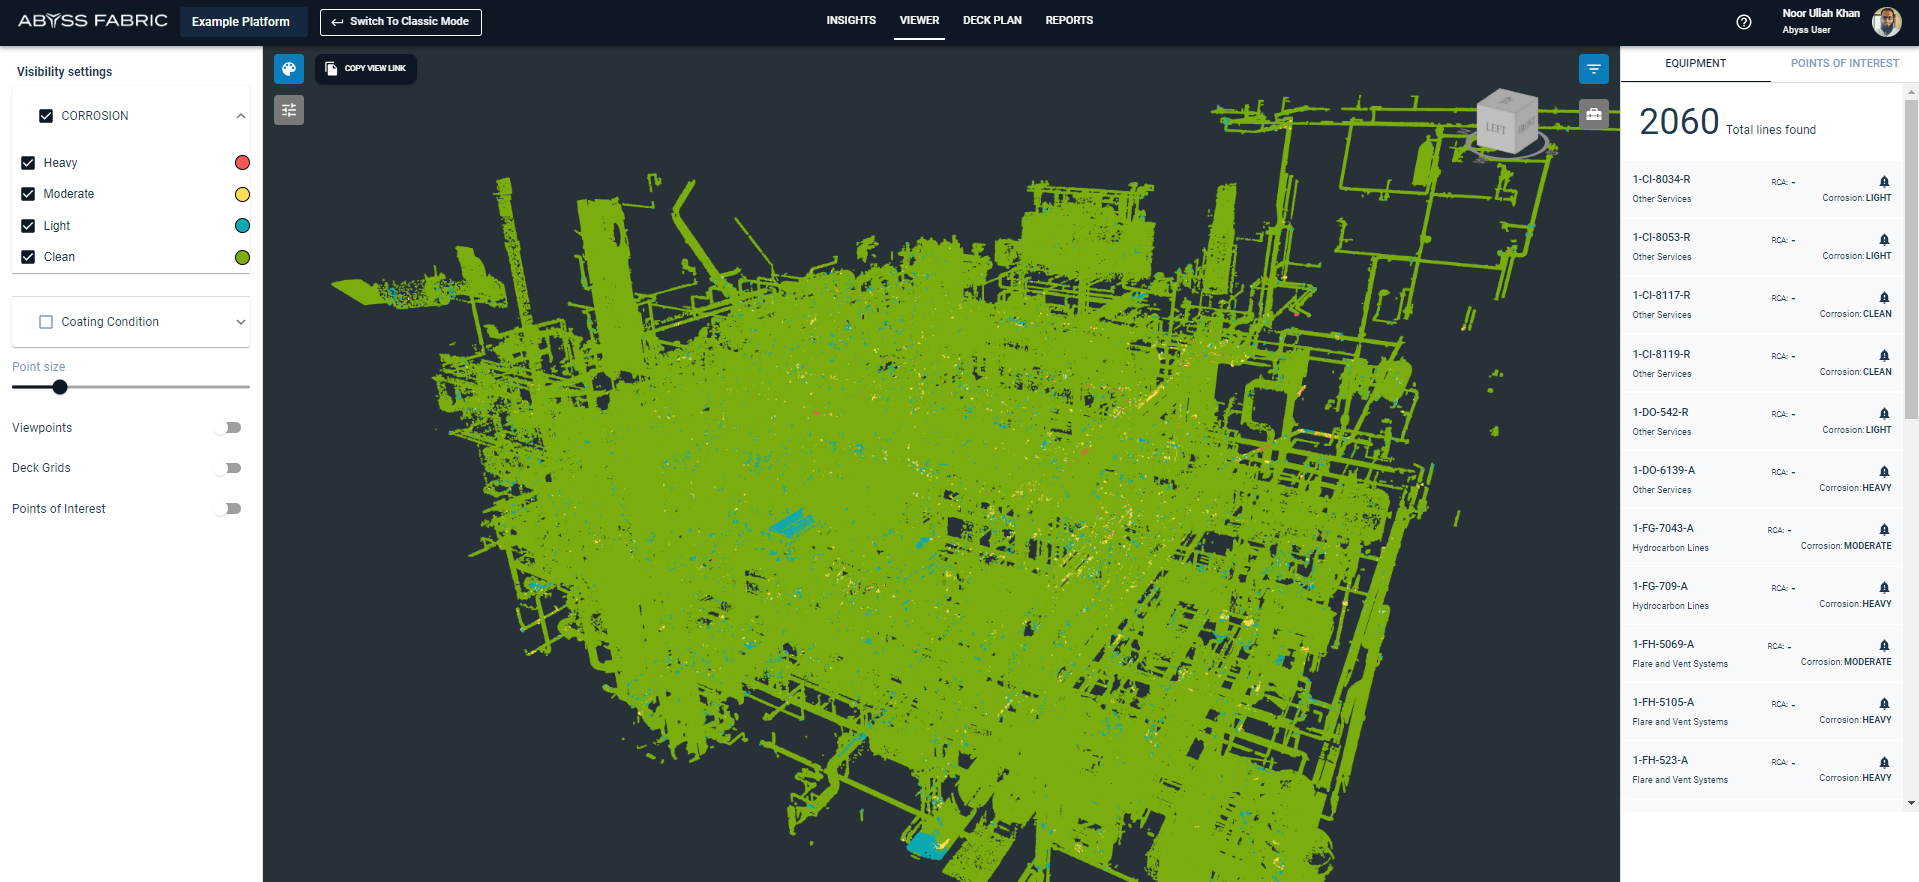
Corrosion
When the Corrosion setting is turned on, the details of the platform will be displayed.
Coating Condition
When the Coating Condition setting is turned on, the details of the platform should be displayed.
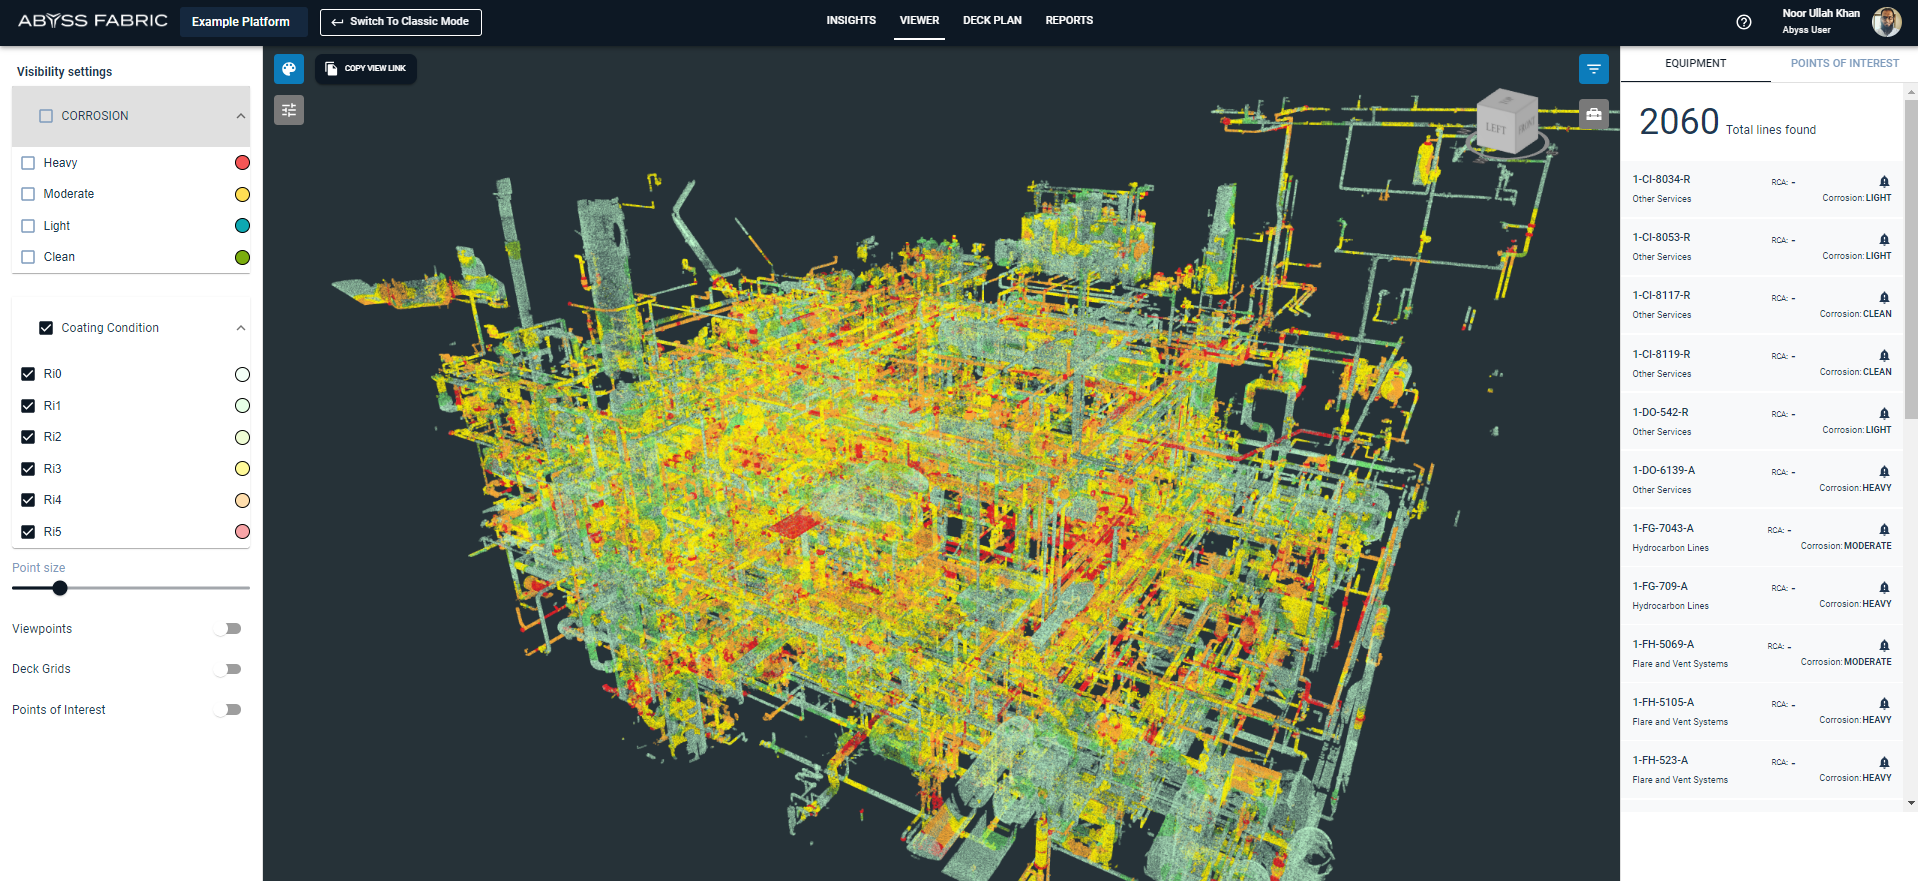
When the button is blue, it indicates that the current panel is open. Conversely, when the button is gray, it signifies that the panel is closed. It's important to note that at any given time, there can only be a single panel open - either the Visibility Settings or Query.
Query
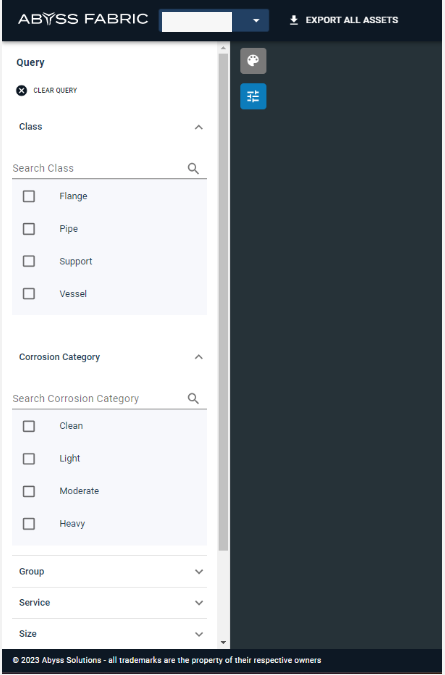
Query Segment can be used with the following filters
Class
Corrosion category
Group
Service
Size
Spec
Inspection Priority
Line Number
Equipment
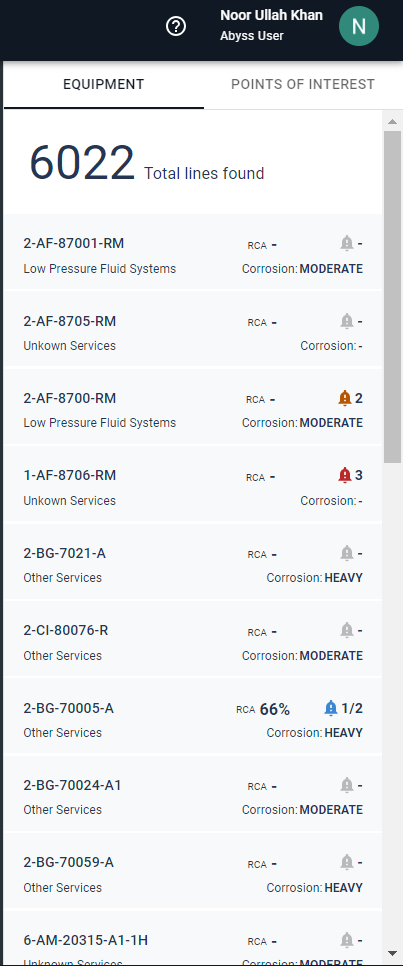
Using Query to Filter the Equipment List
By applying a filter through Query, you can easily highlight selected equipment in the 3D Point Cloud. This feature is particularly useful when reviewing specific equipment within your selection and streamlines your workflow.
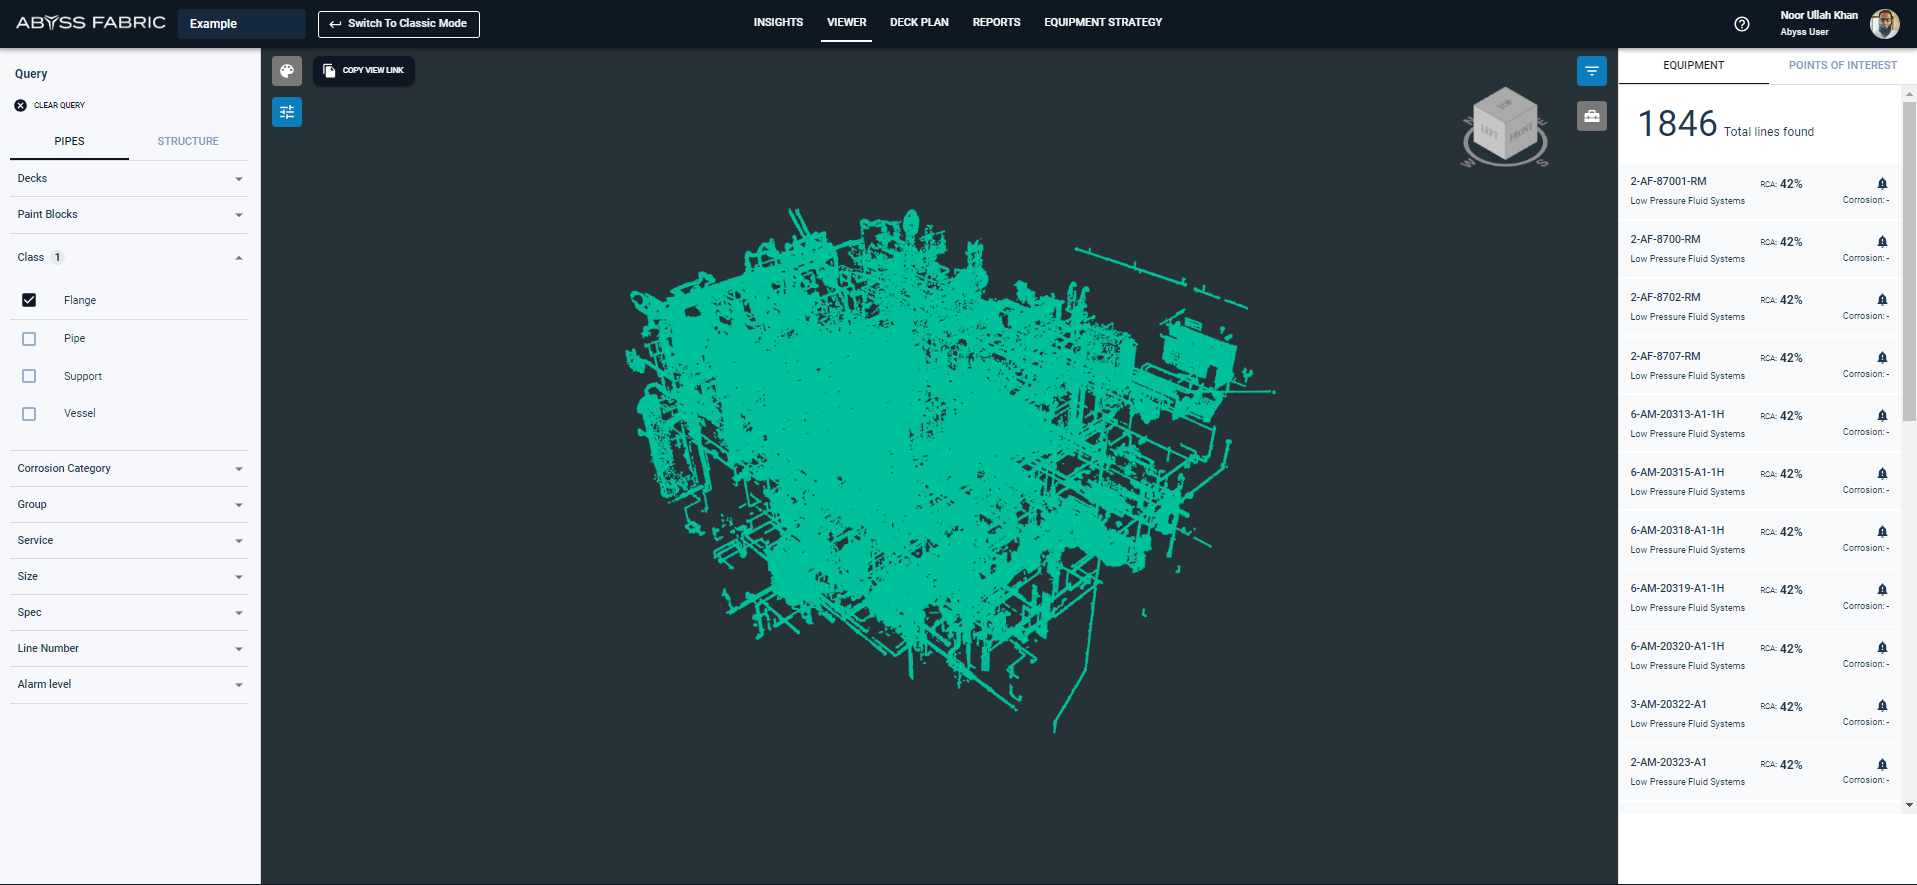
This feature allows users to easily identify and locate specific equipment within the system. By selecting an item in the 3D point cloud, users can quickly navigate to its corresponding entry in the equipment list. This saves time and improves efficiency when working with large datasets.
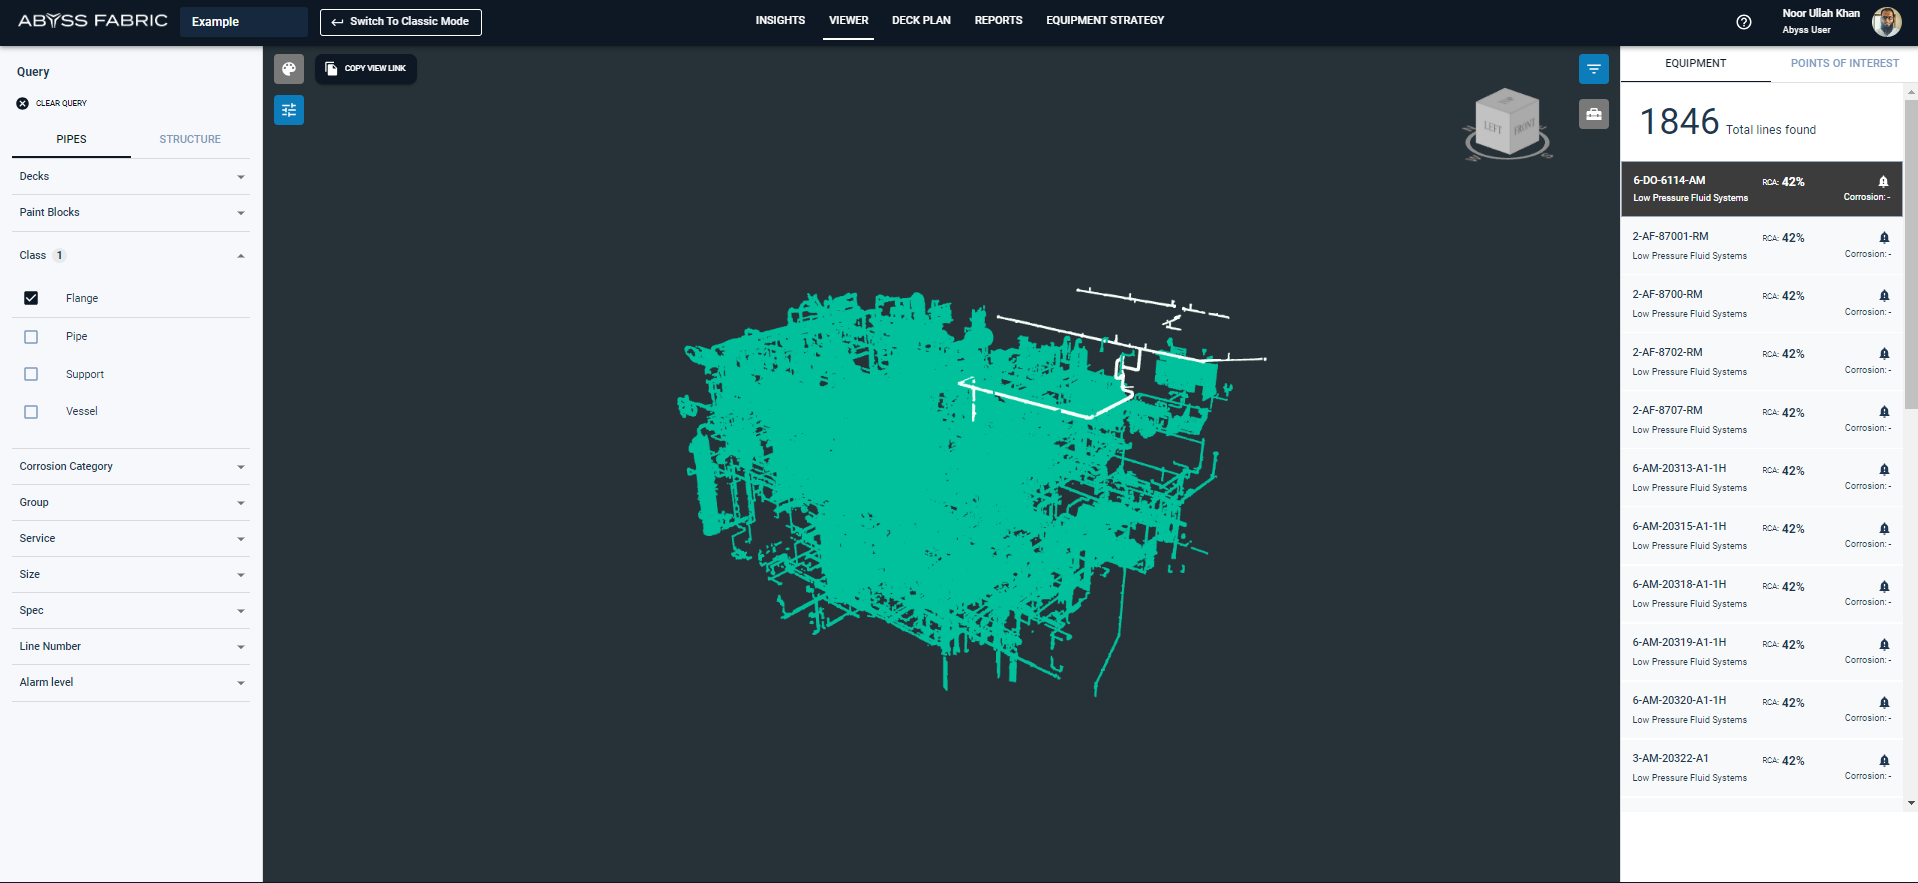
When the selected item in the equipment list is clicked, it opens the details of the item, the details show the following:
Corrosion Level
This shows the corrosion details for the condition of the equipment.
Degree of Rusting
This shows the rusting details of the equipment.
Associated Viewpoints
This shows all the viewpoints that covered the piece of equipment.
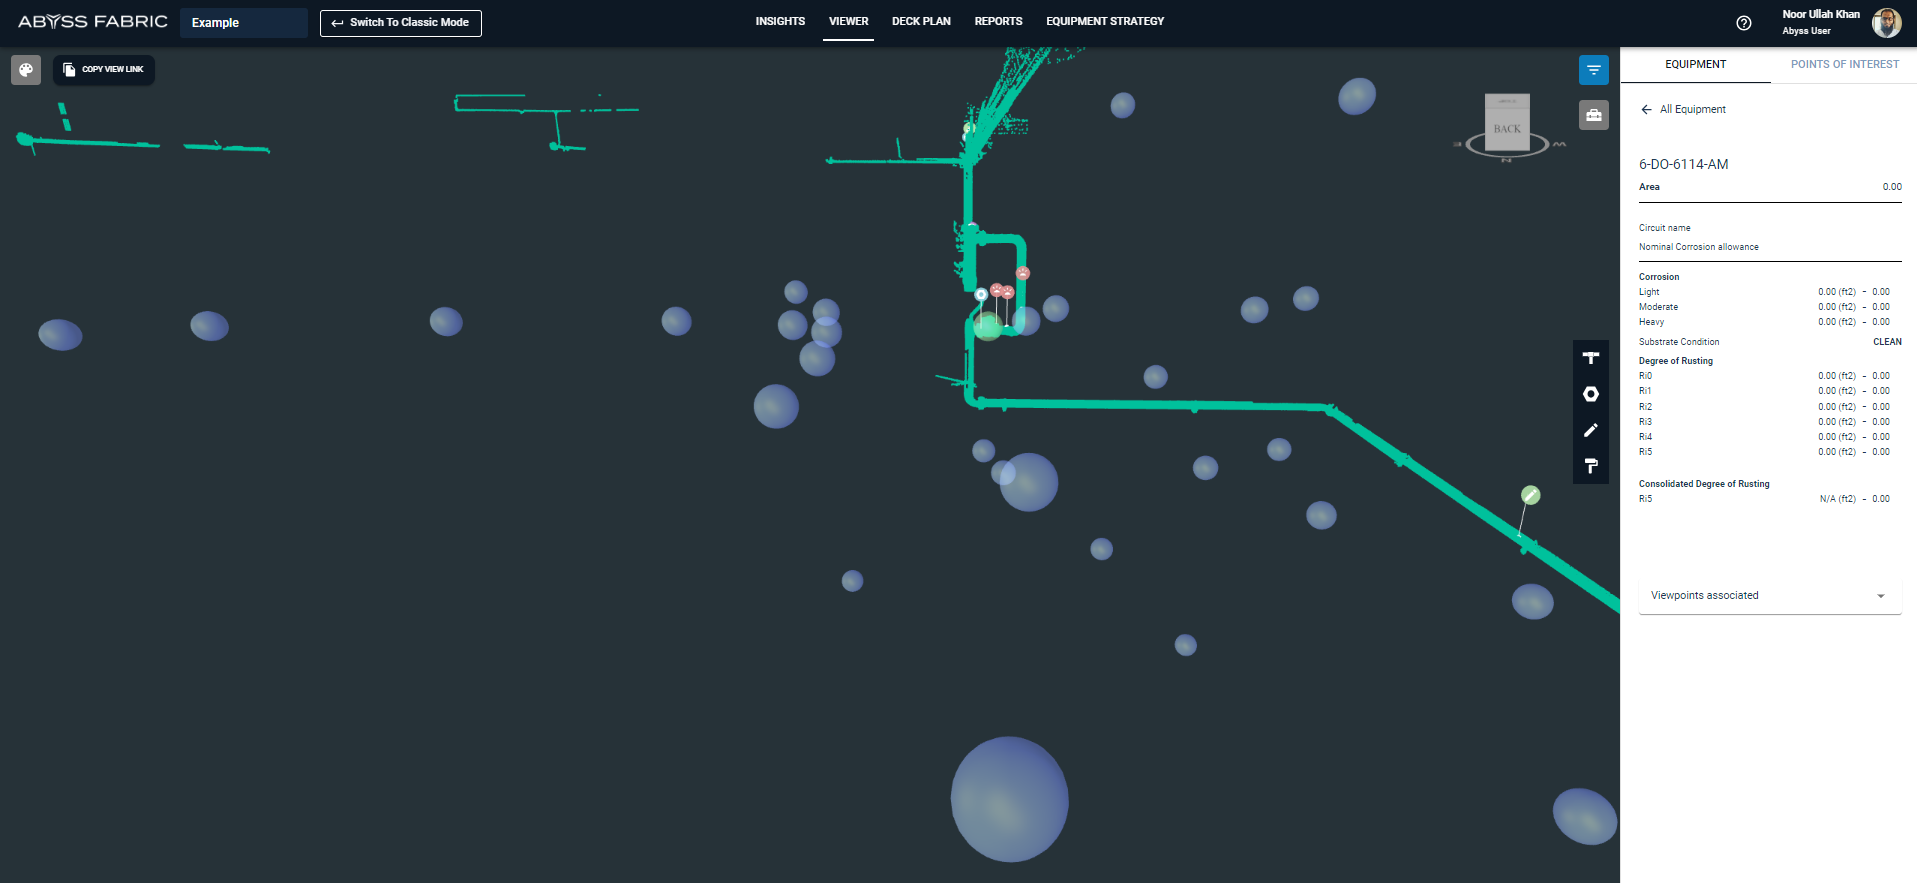
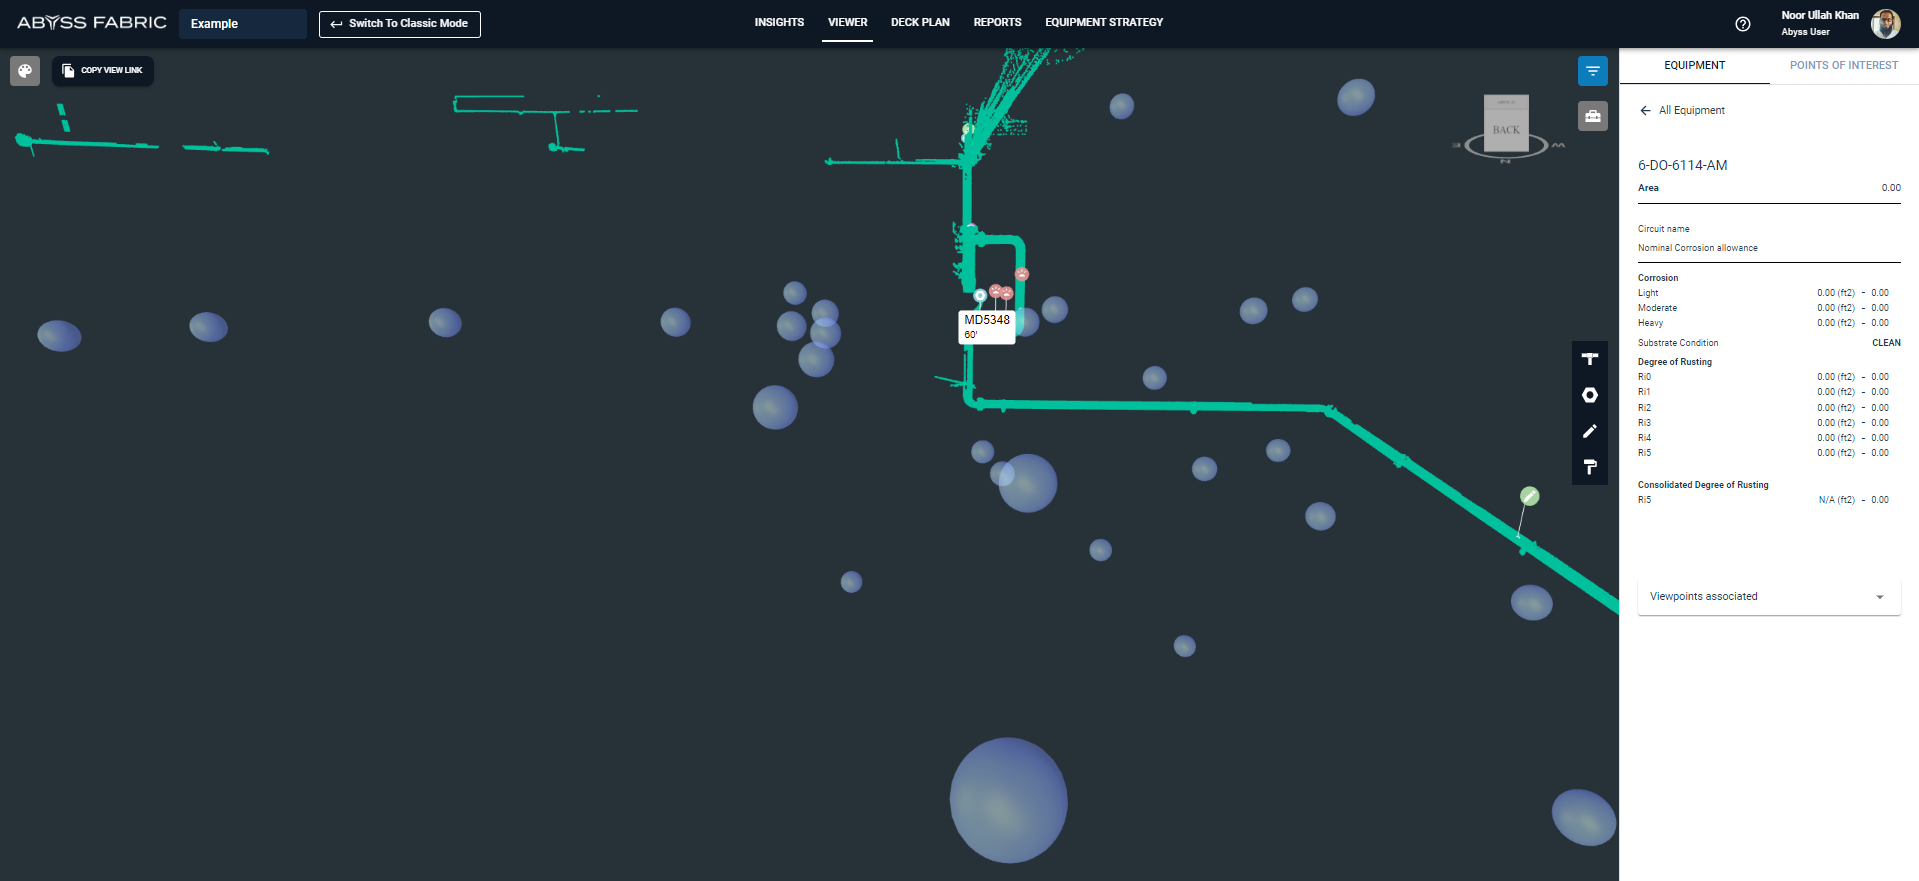
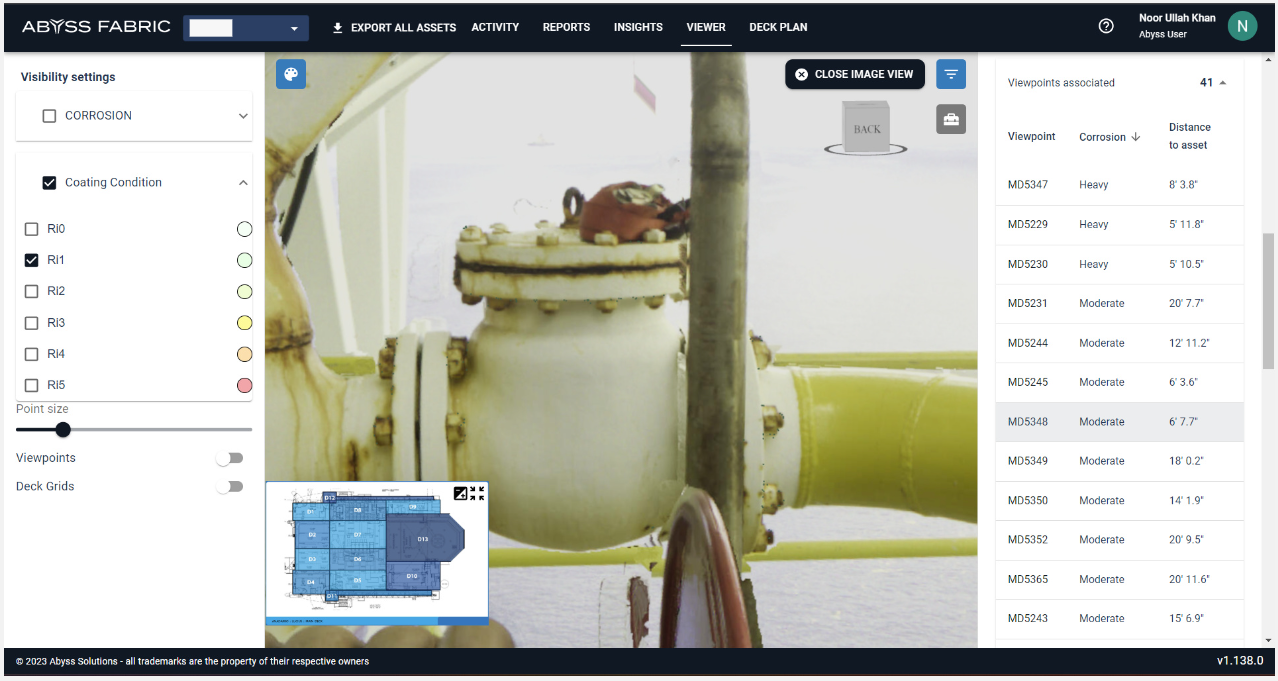
To view a specific viewpoint, simply click on it. In this example, we clicked on viewpoint MD5348. After selecting a viewpoint, an associated image will open up with 3D points displayed as shown in the point cloud. You can zoom in or out of this image to get a better view.
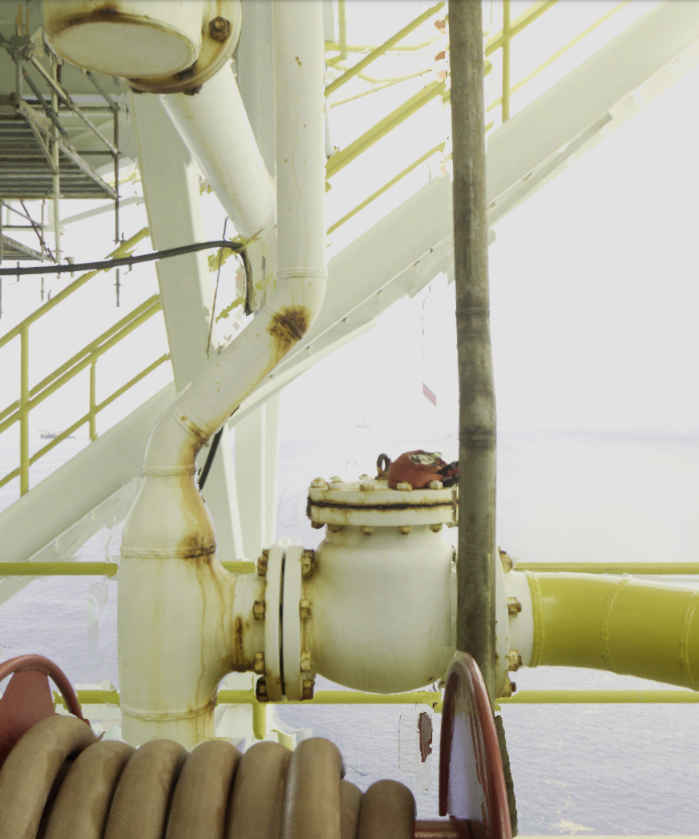
When you enter into image view mode, you'll notice a "remove highlight" button located at the top left corner of your screen. Clicking this button hides all highlighted points over equipment that are otherwise visible by default. To show them again just click the "highlight asset" button once more!
Points outside viewpoint
Update Images
The image view turns pink for the last visited Spherical
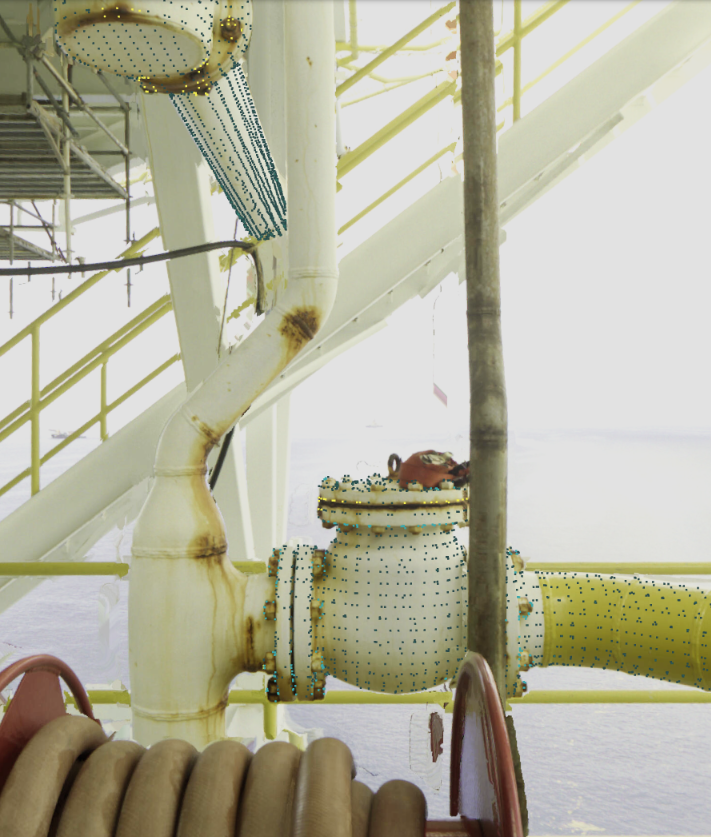
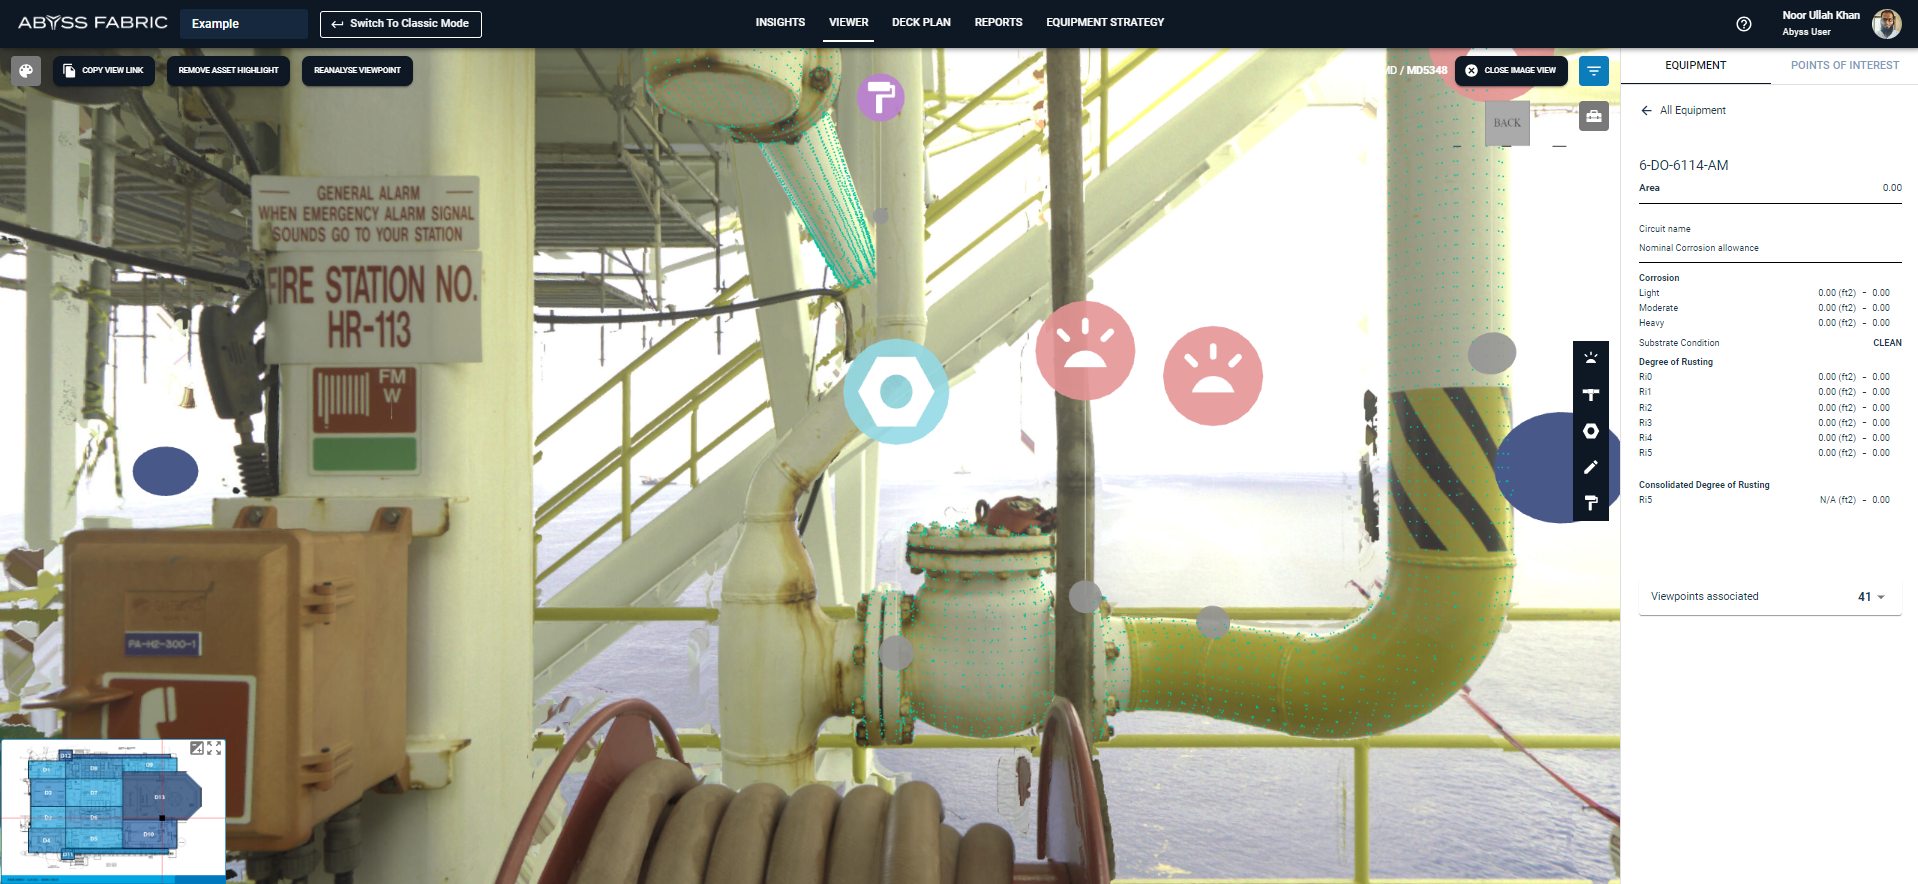
After zooming out the image will show the additional viewpoints available, once we click the viewpoint the system will process and jump to the selected viewpoint.
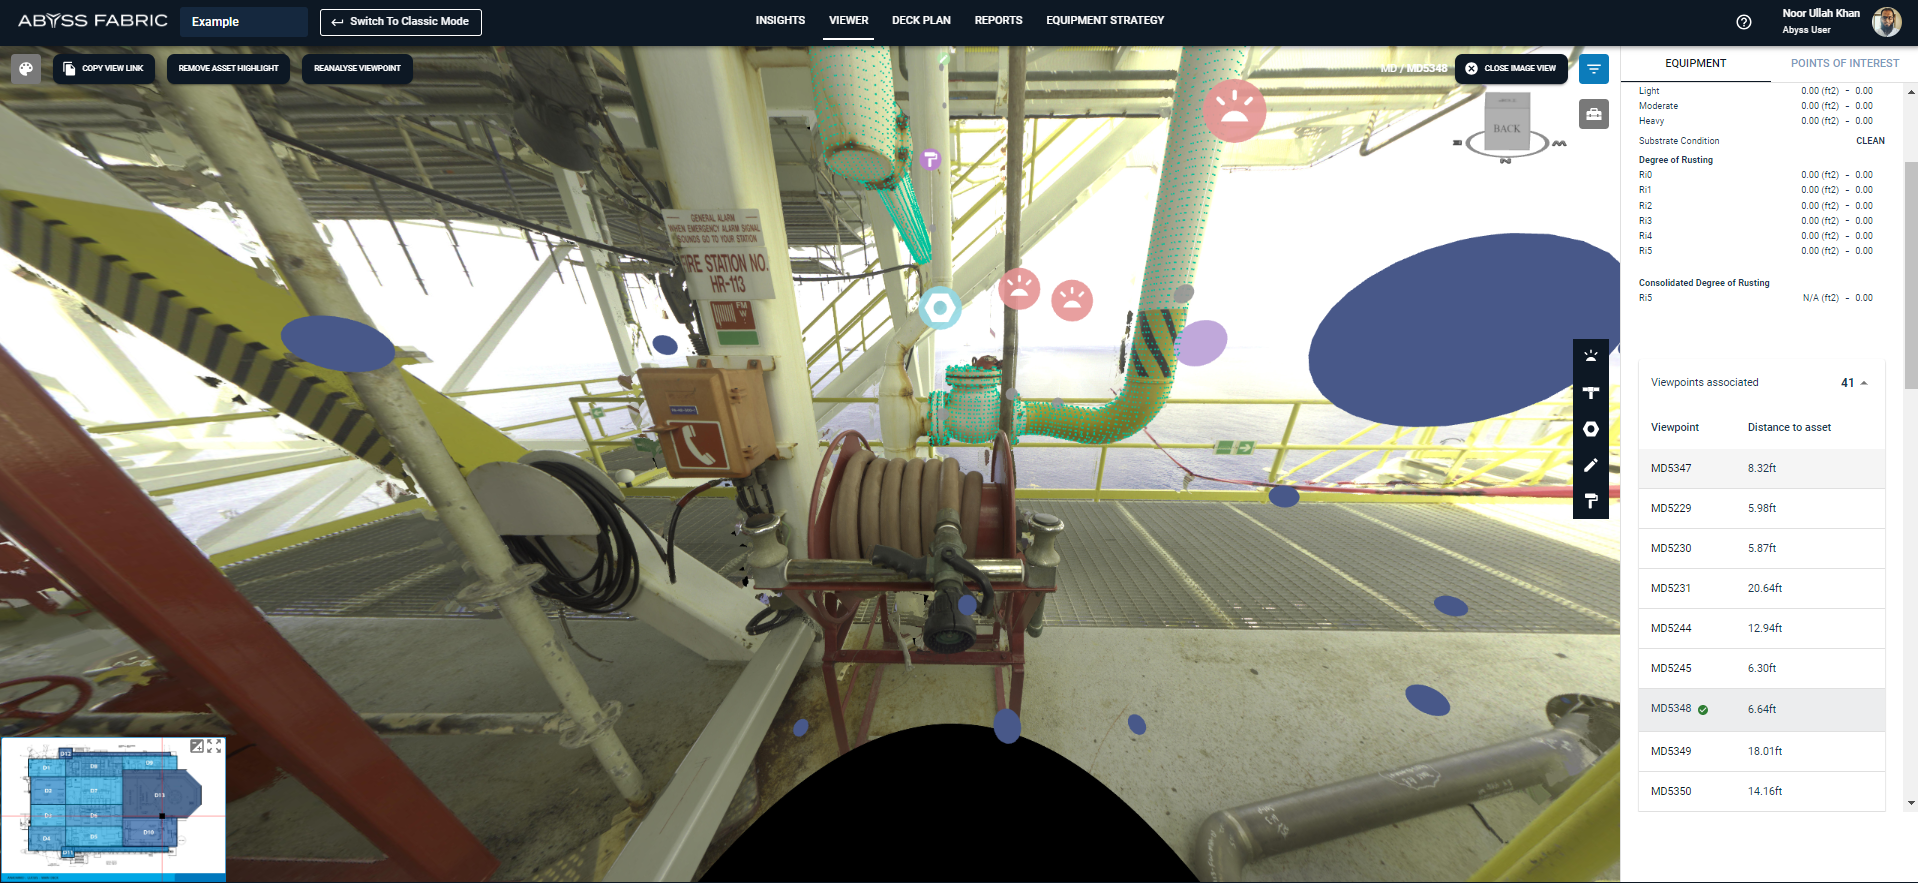
View Point selected was MD5347
This shows the selected item from a different angle, which provides a better visual for the item.
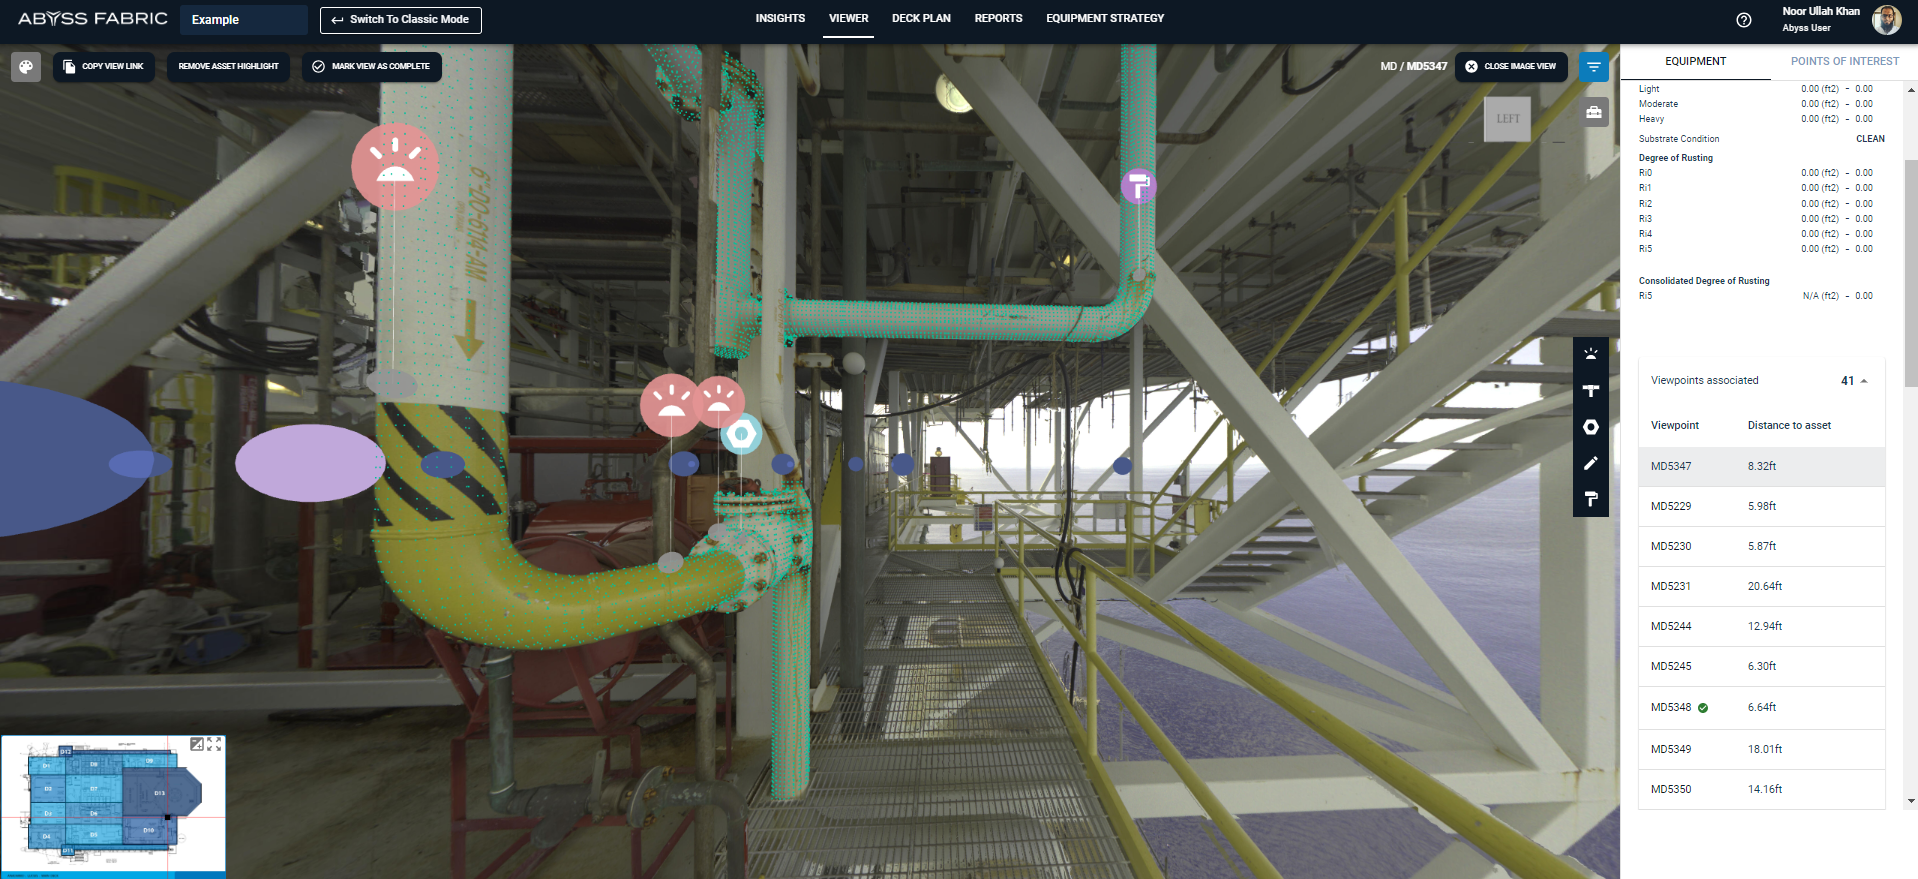
Previous visited viewpoints will be highlighted in pink color.
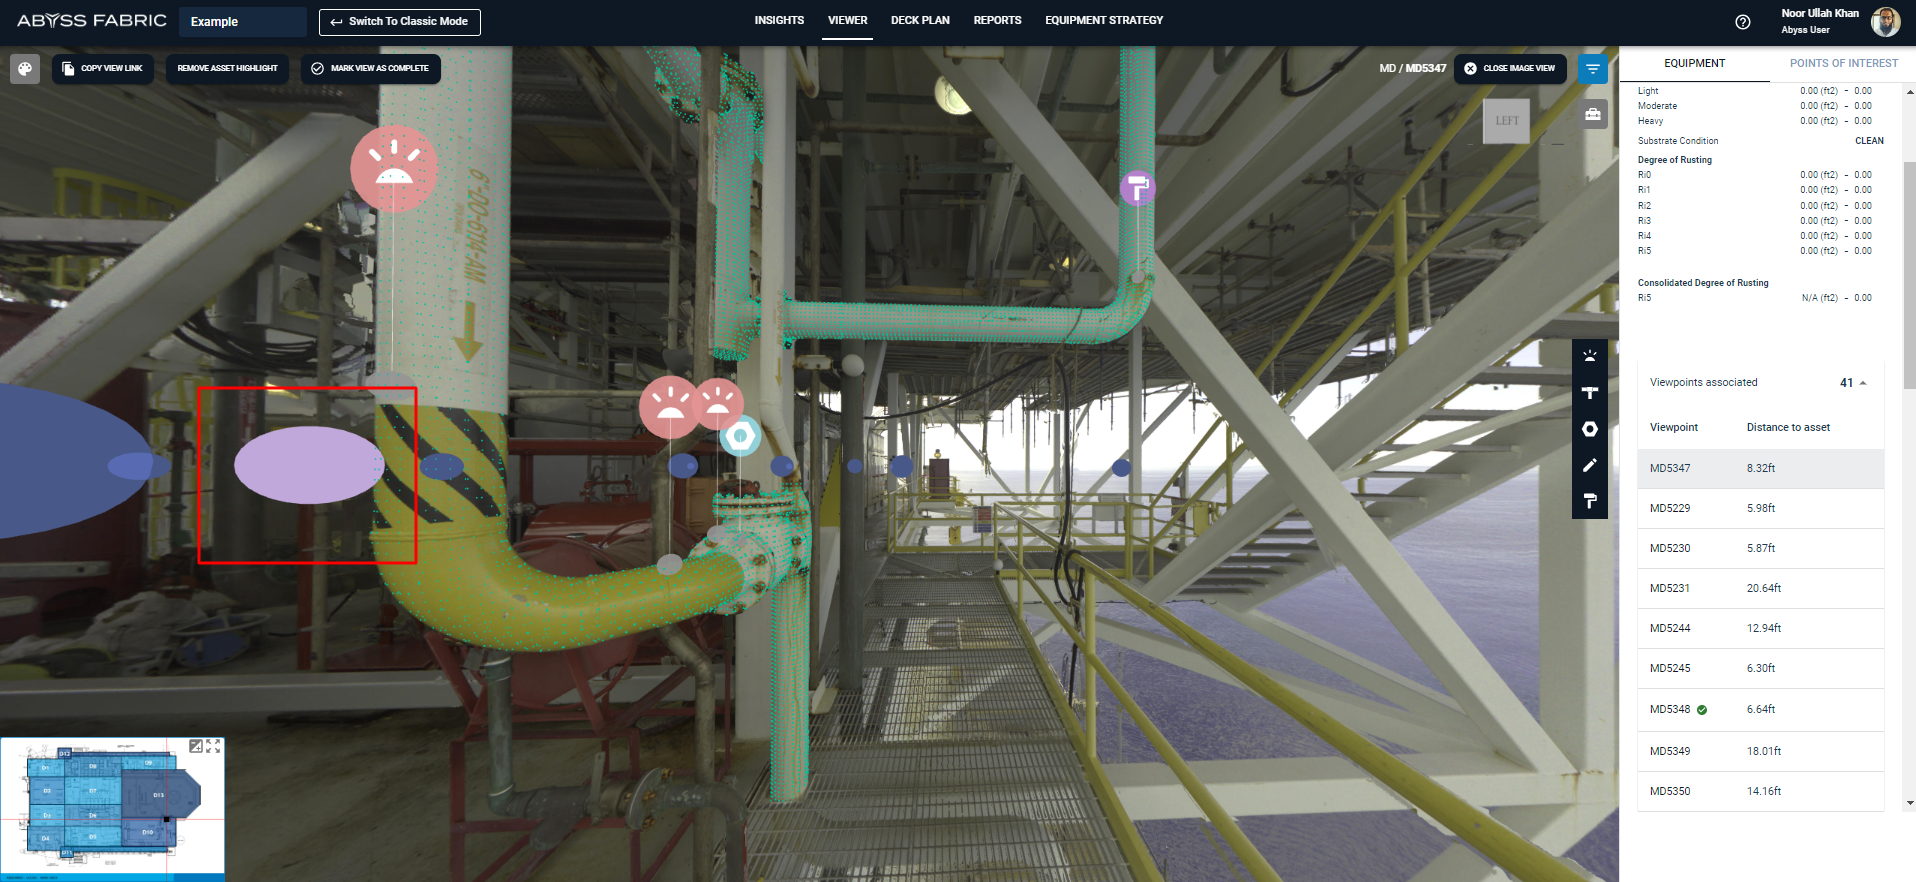
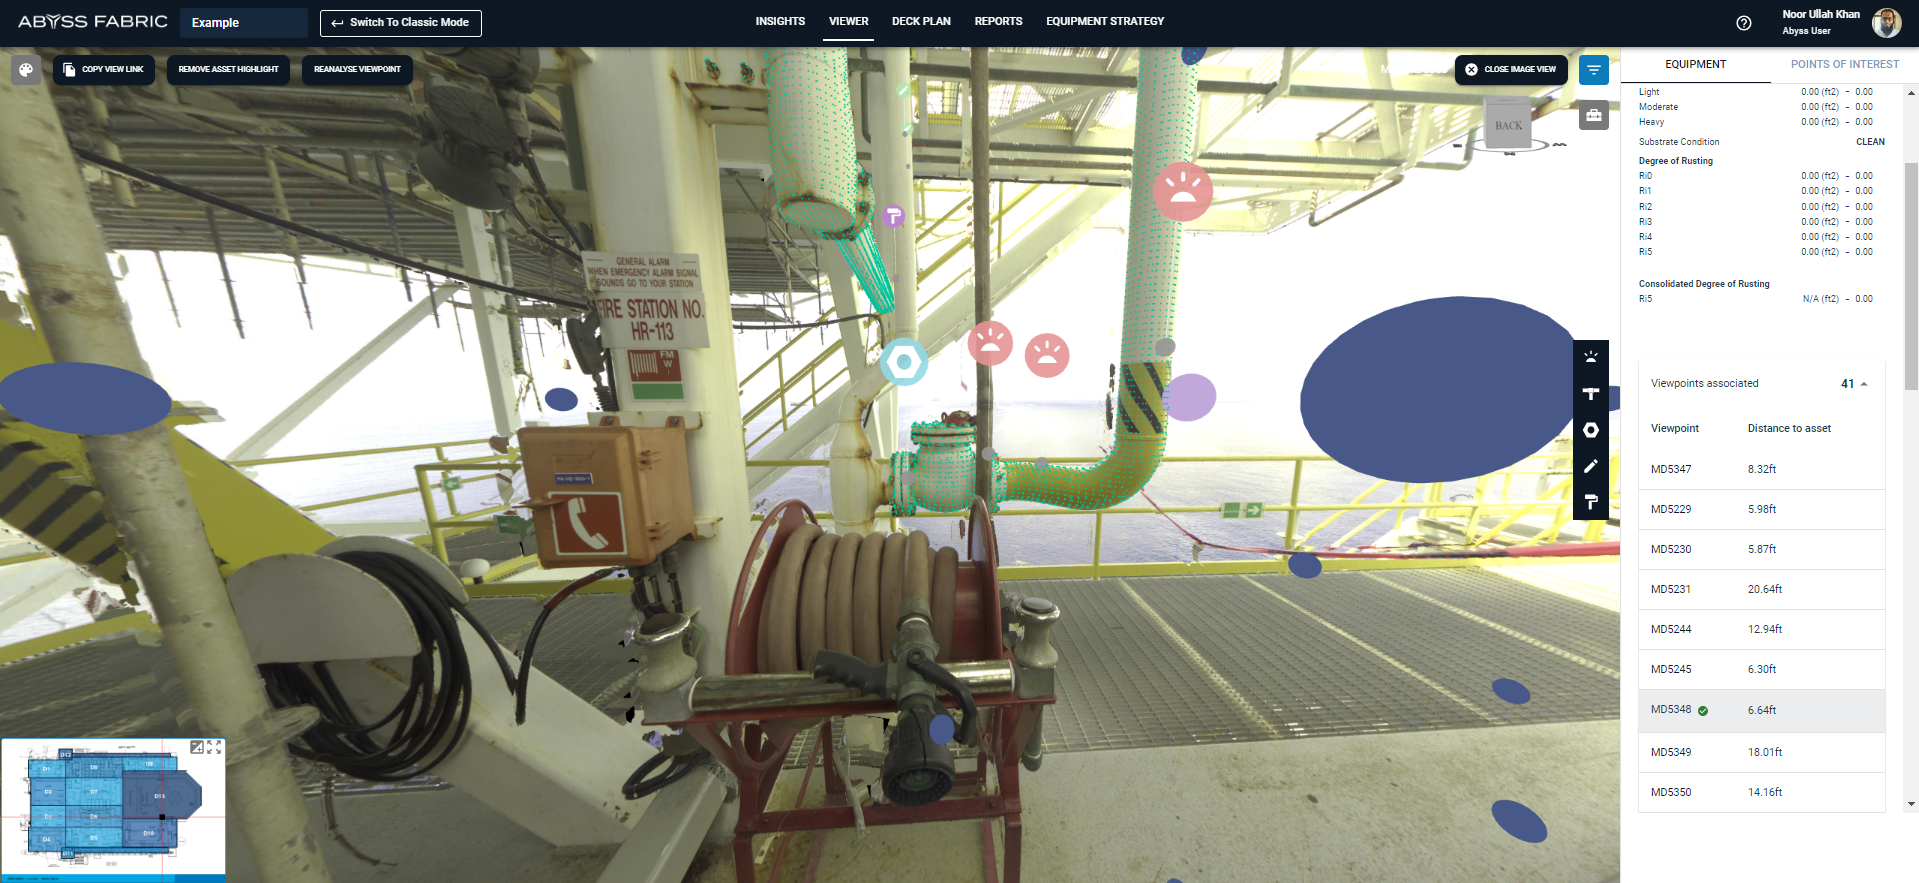
The palette button opens up the drawer on the left side which shows visibility options.
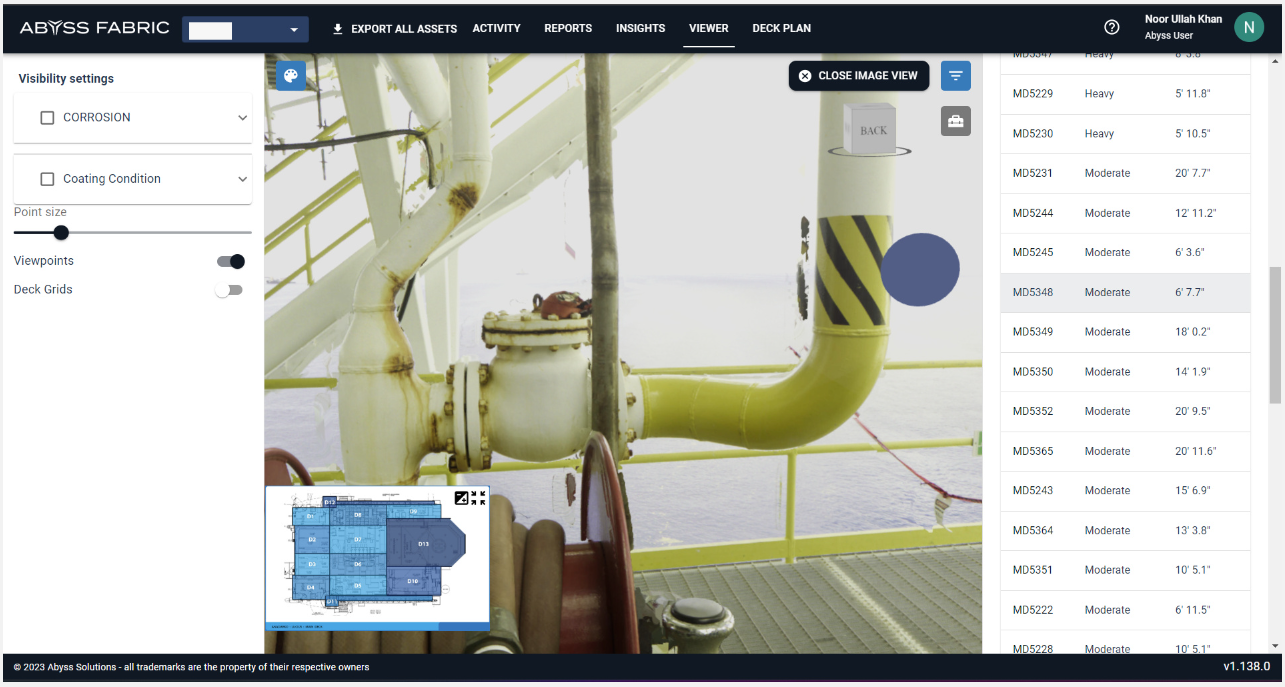
When
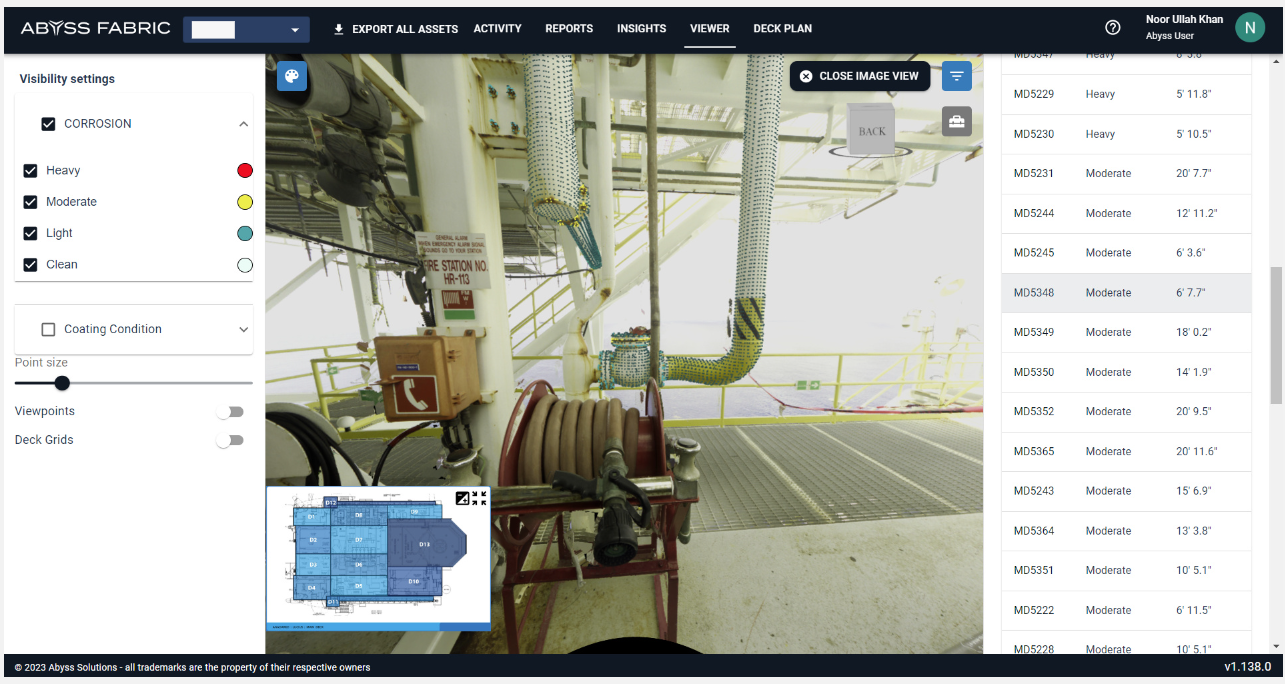
This equipment has only Moderate and Light corrosion. The image does not show any trace of heavy corrosion.
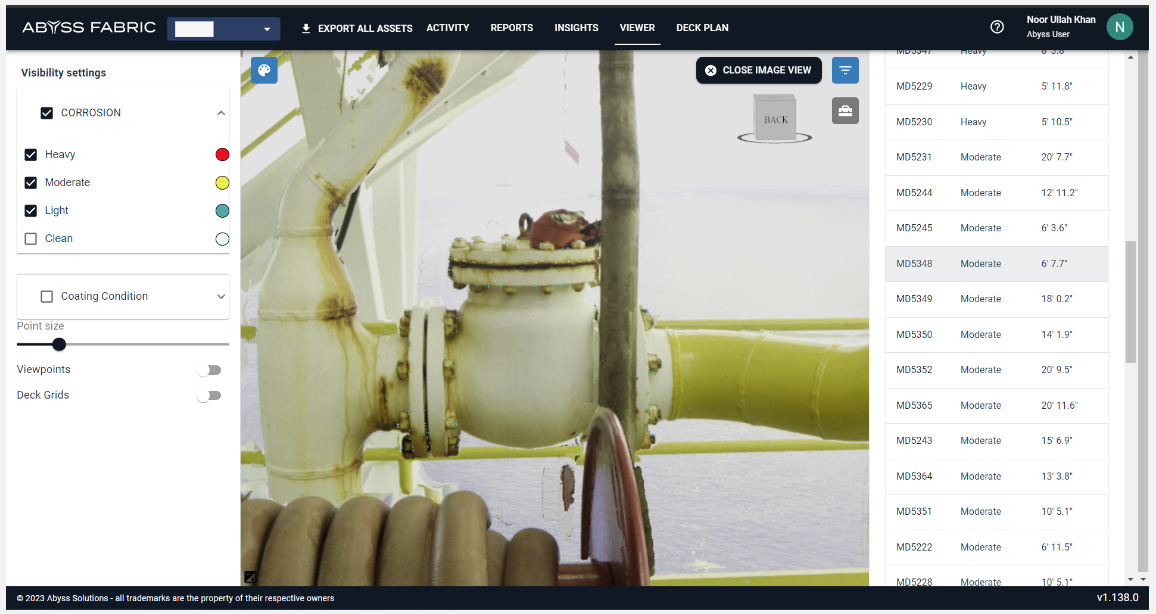
Coating conditions work in a similar way as corrosion, the list can be selected for each coating detail which will be highlighted in the image, As an example the image only has Ri1 coating assigned to the image.
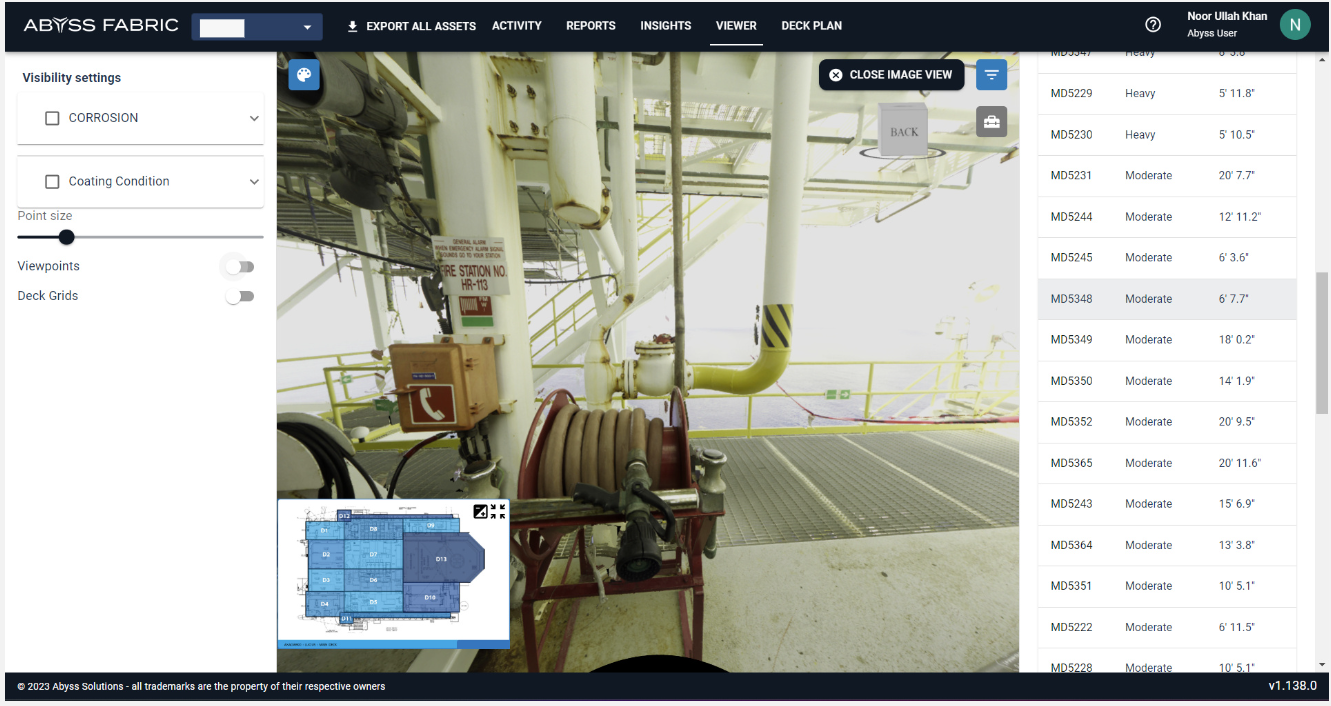
Turning Off the viewpoints button will remove all the viewpoints in the image, they can be turned on again and the respective viewpoints can be viewed.
Picture in Picture
In the image viewer on the bottom left side, there is a picture in picture (PIP) with the respective deck plan showing where the selected equipment is present. This PIP will highlight the position where the equipment is present.
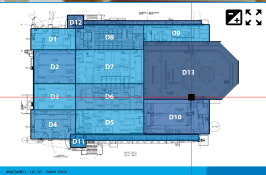
On the top right side of the Picture in Picture, there are two buttons explanation of the bottom as follows:

This button will increase the size of the PIP panel,
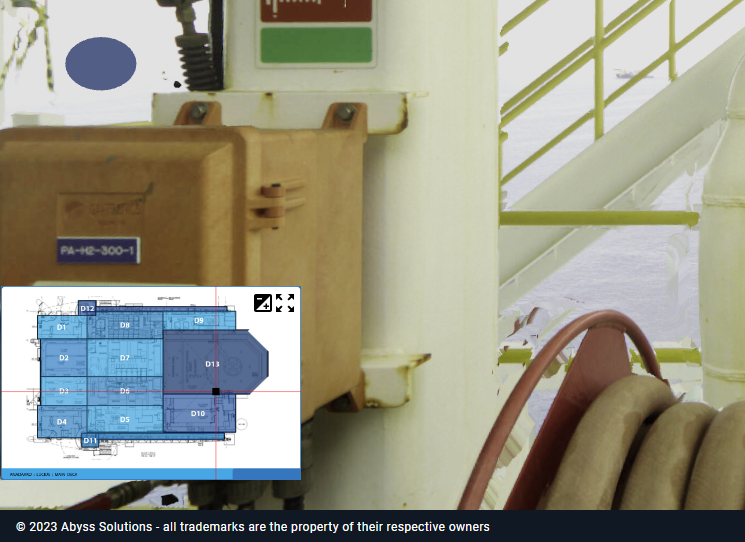
By default, the Picture-in-Picture (PIP) feature displays a small window within the main screen. However, when you click on the button to activate it, the size of the PIP increases as shown in the image on the right. This can be useful for better visibility or if you need to focus on a particular area of your content while still keeping an eye on everything else.
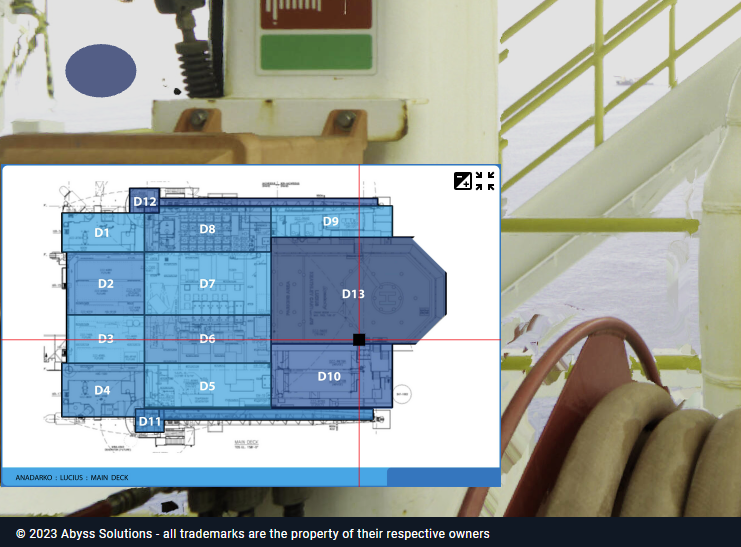
When the button is pressed again, the size of the PIP decreases as shown in the image on the left.

This button will minimize the PIP.
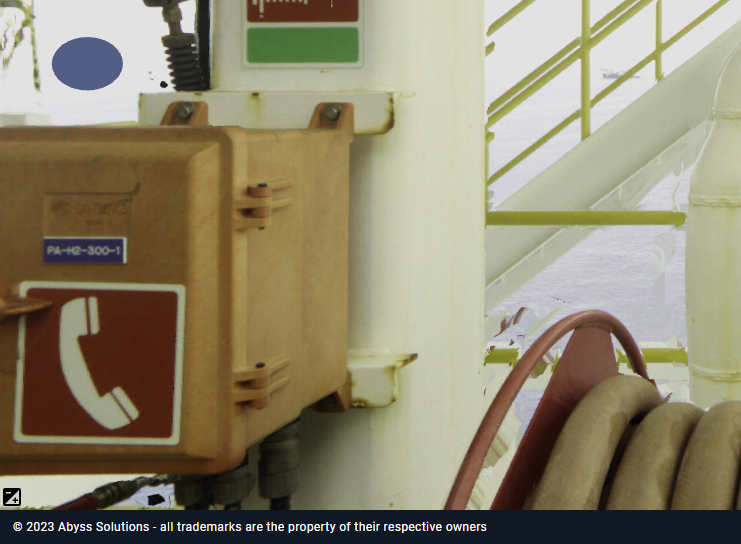
Point of Interests
The point of interest is essential for users to mark essential information on the 3D point cloud or the image viewer, the point of interest can be assigned to either Cups, Hotbolting, Blisters, or others. In others, the user has the liberty to maintain any user-specific criteria that can be used in a report.
As a sample, we will assign a Point of Interest to the equipment.
We will select the class “Flange” which will filter the equipment. The equipment count will be reduced to 1849
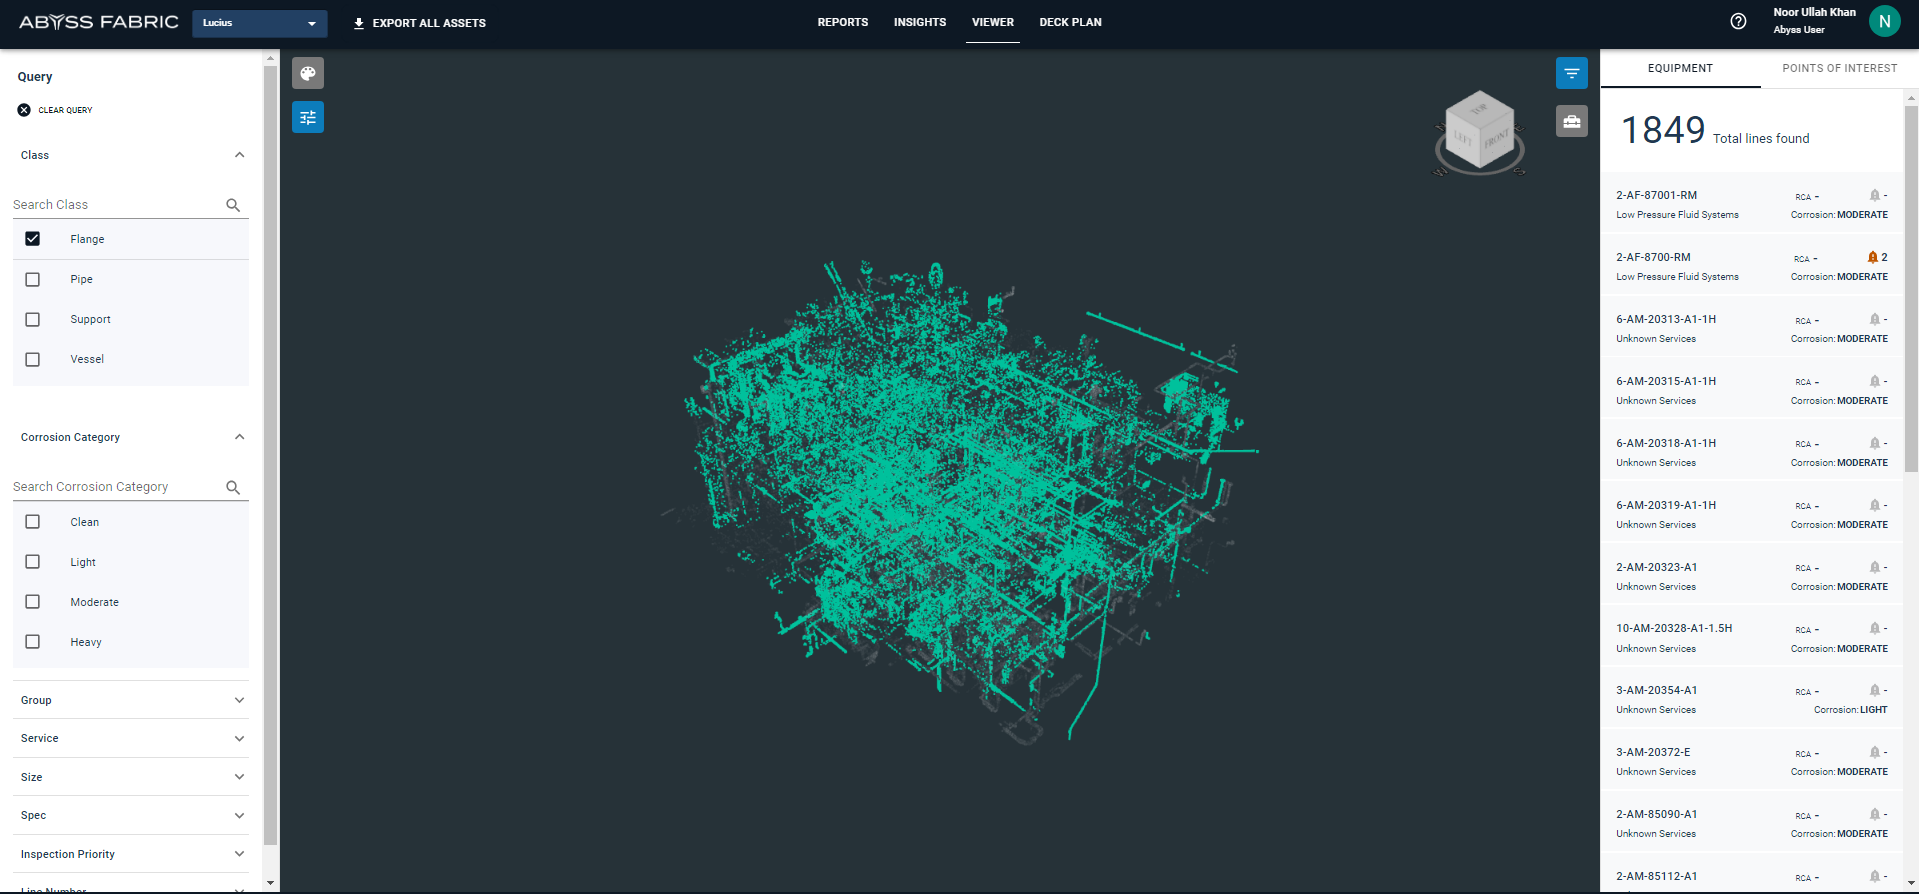
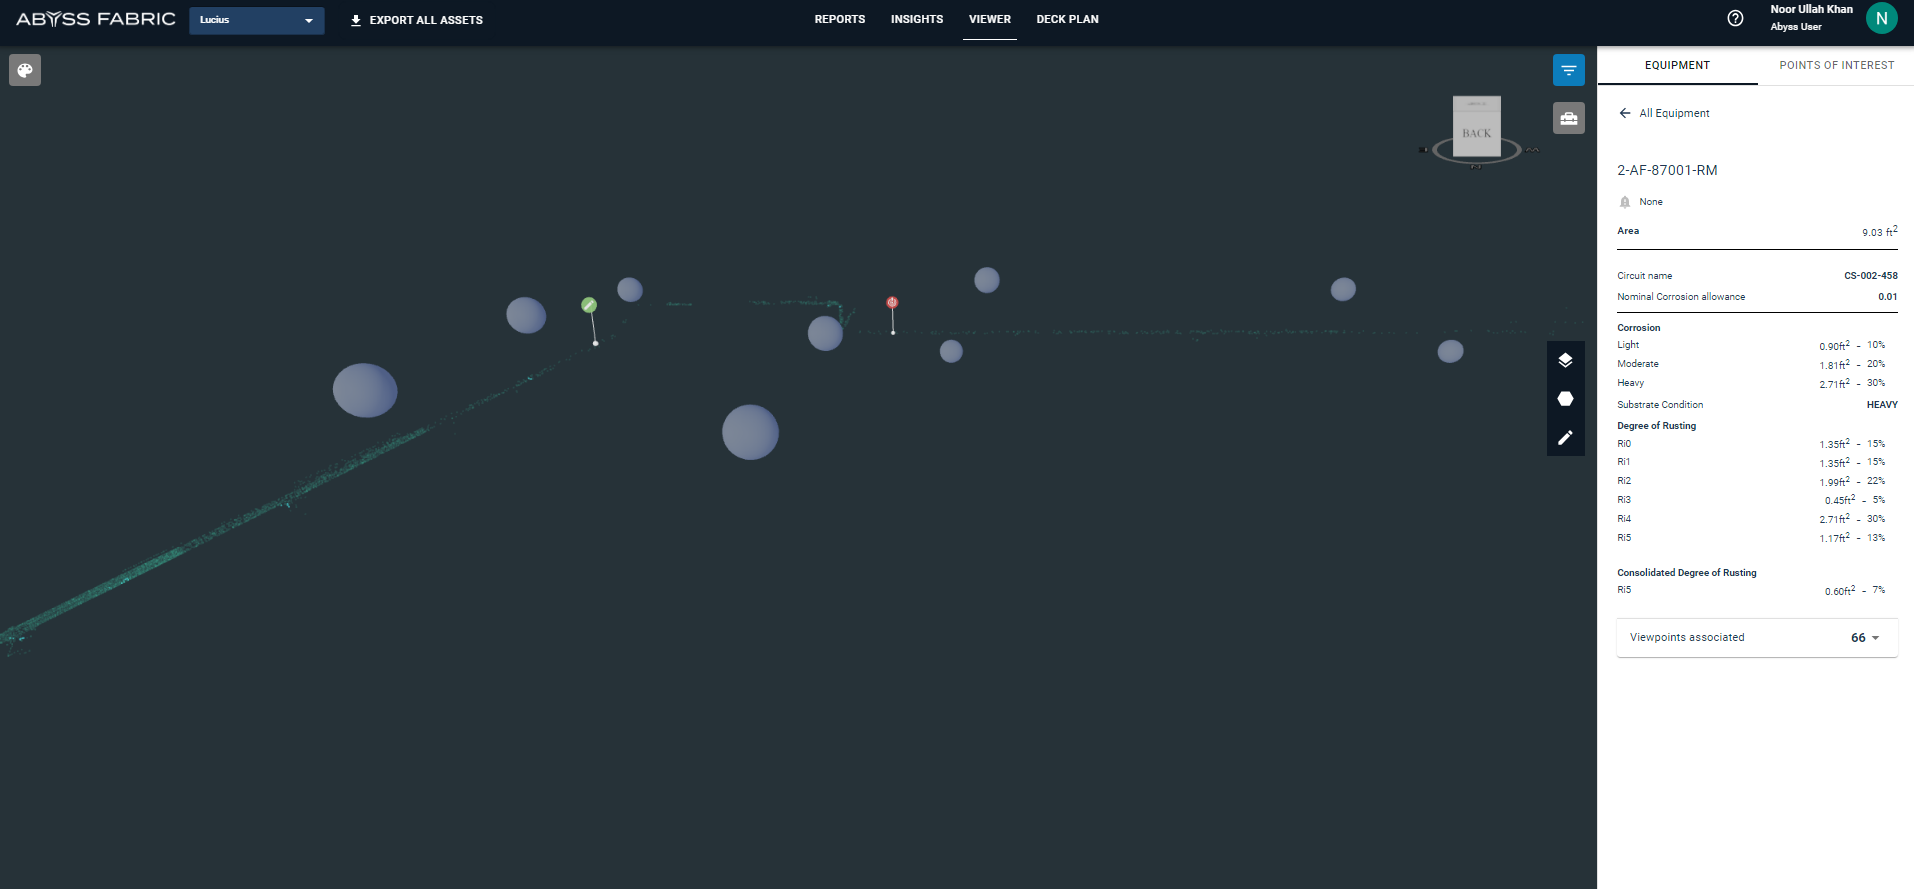
Select the first equipment, and this will take the user to the closeup viewpoint where the required spherical would get selected.
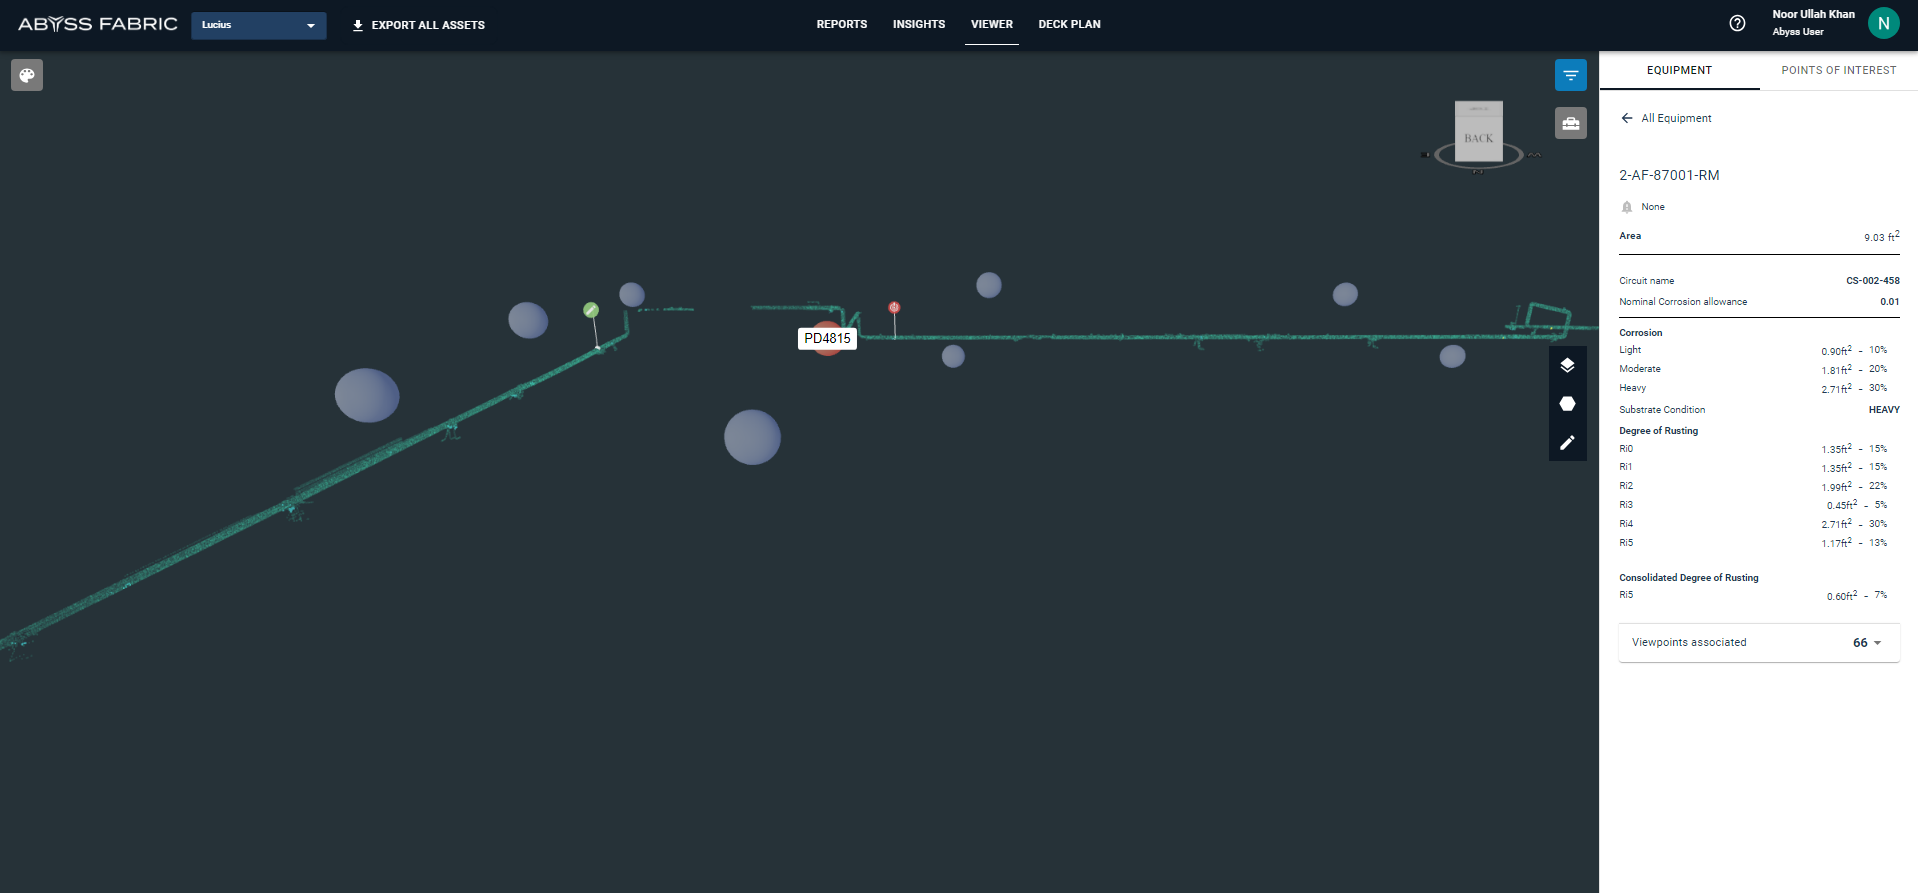
We will click PD4815 spherical and this will take us to the image view.
Next, we will select a piece of equipment for which we need to assign the point of interest and will select the point of interest required from the
Hotbolting
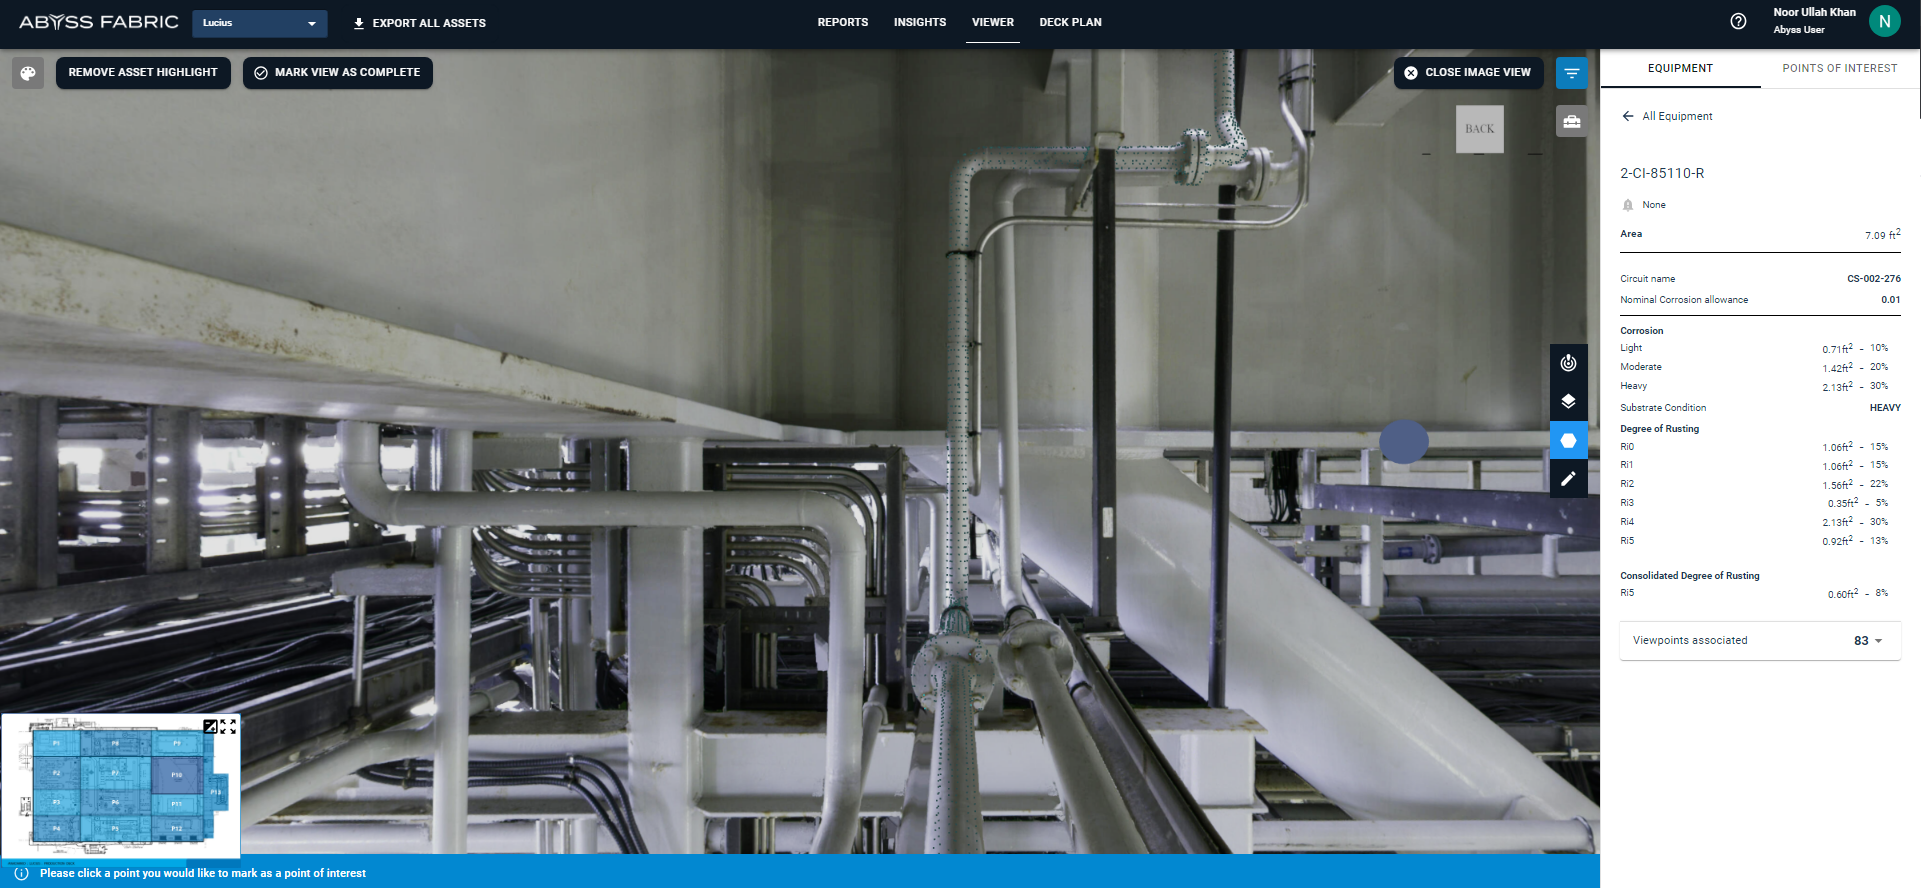
Select the Hotbolting Point of Interest from the POI Drawer.
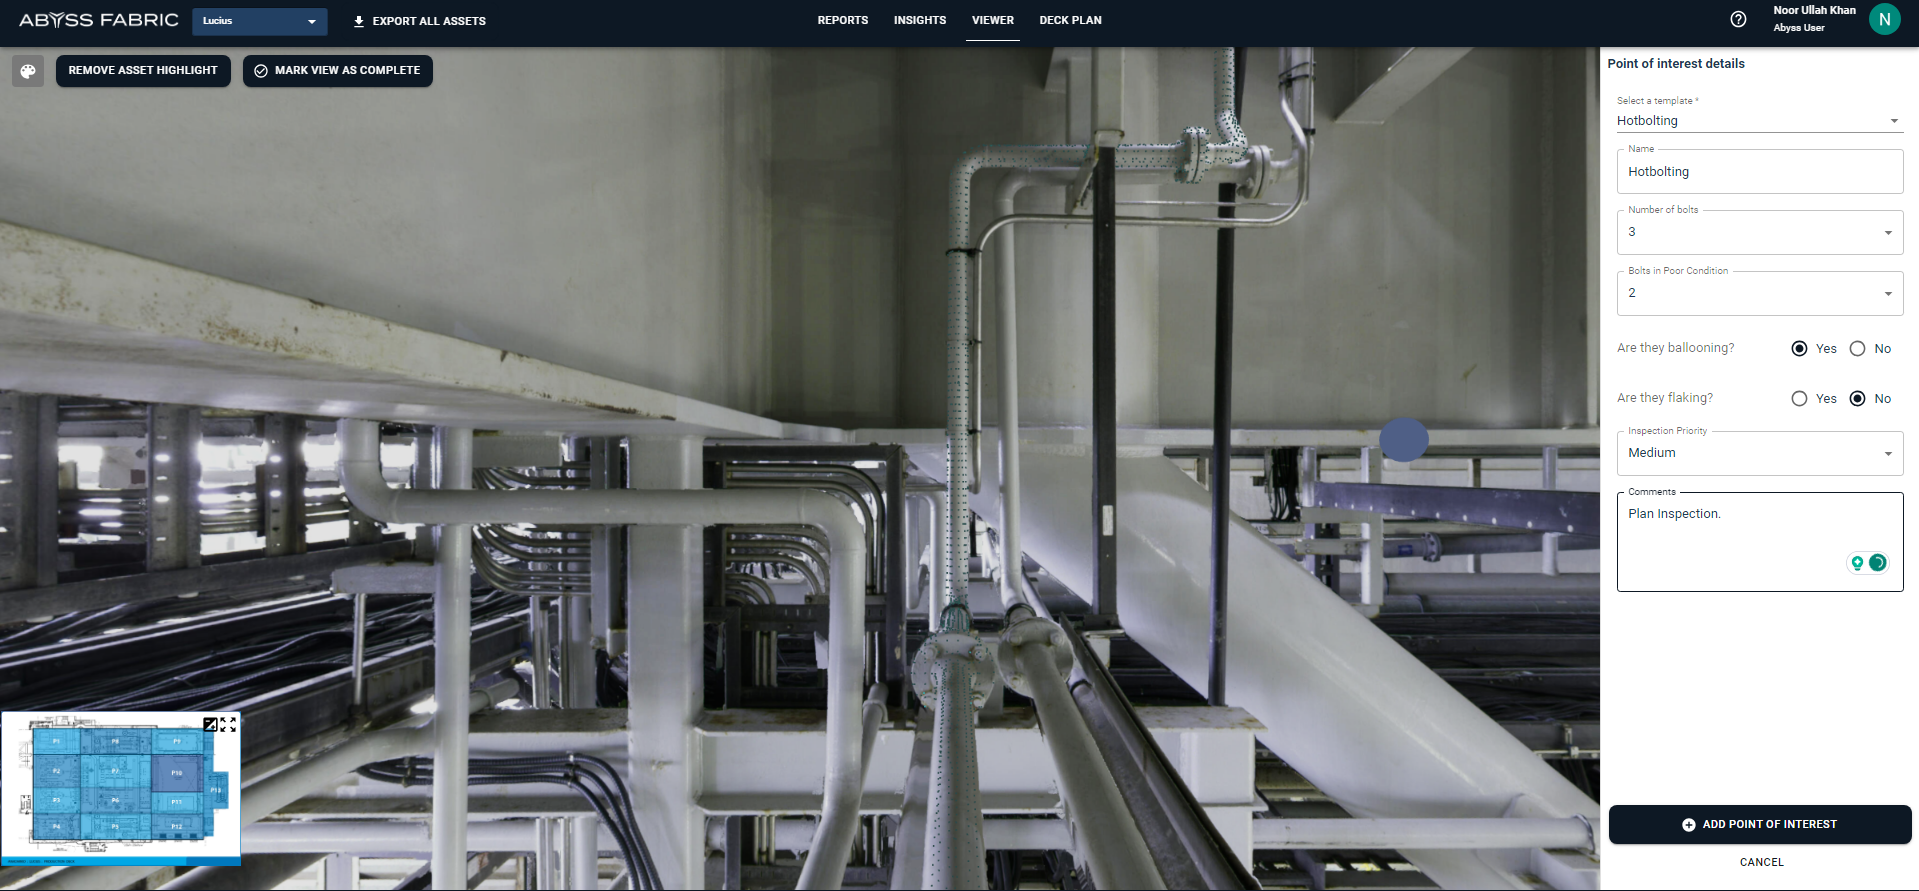
Add details to the Hotbolting point of Interest and Press the Button Add Point of Interest.
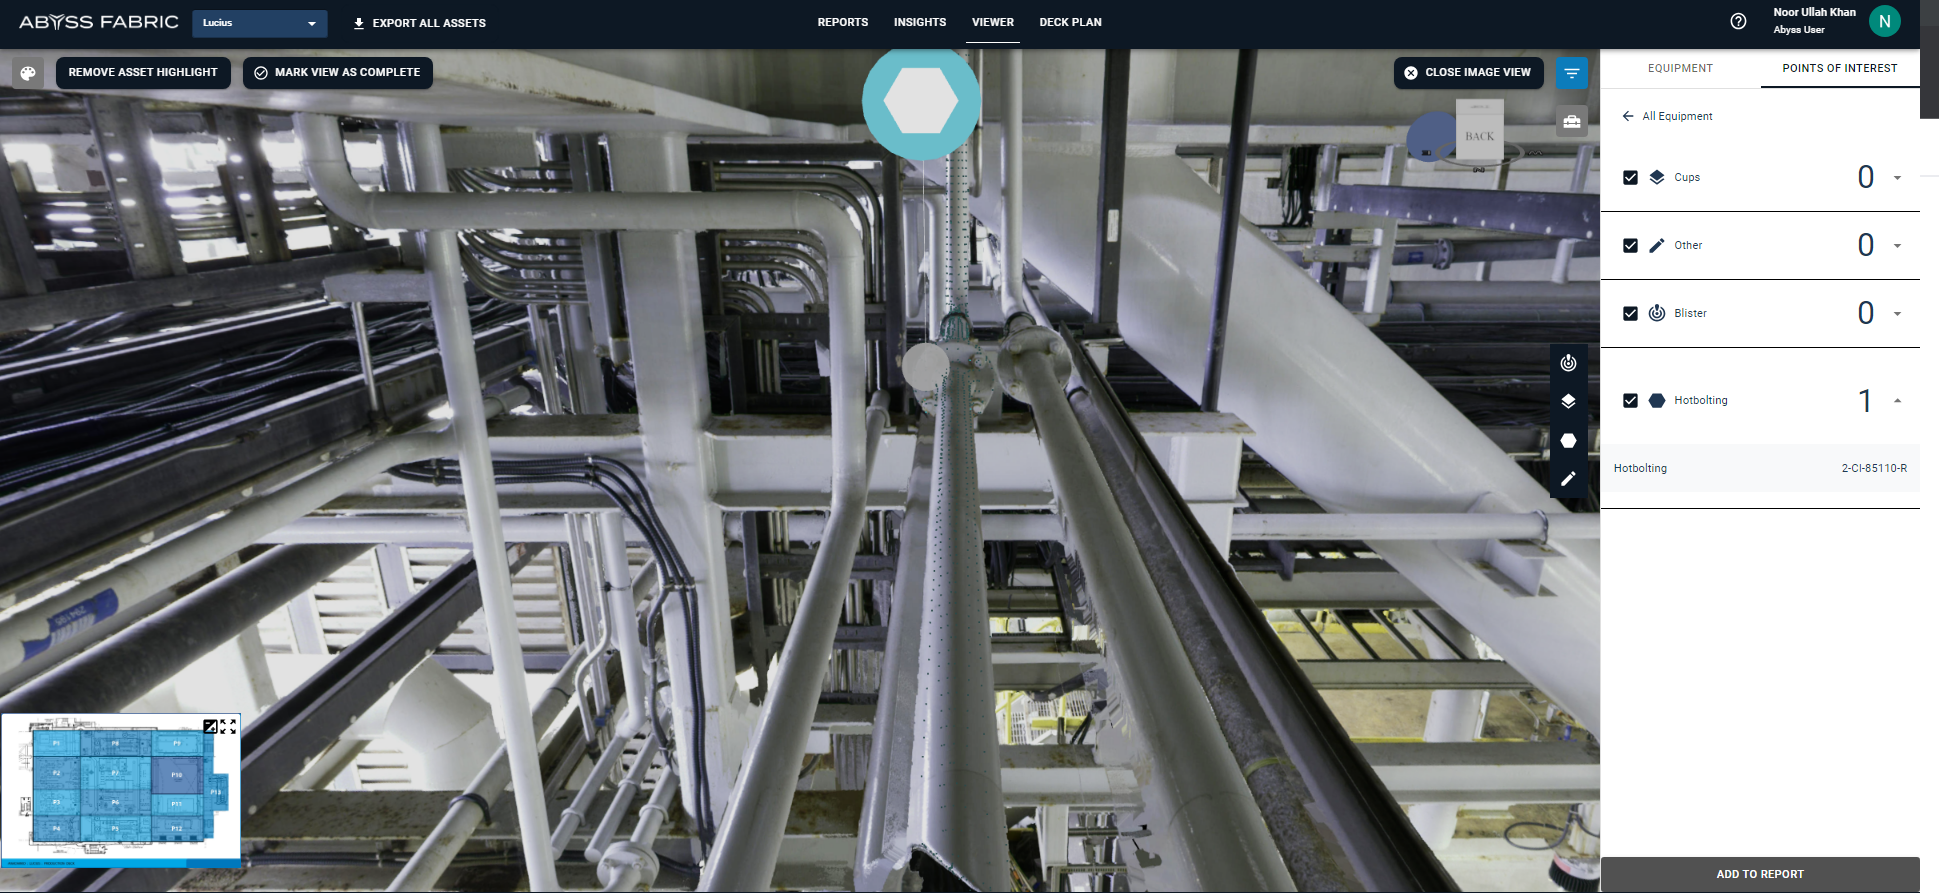
The assigned Point of Interest will be displayed, this can be added to the report. Details of adding to the report will be shared later in the guide.
POI Blister
We select another piece of equipment from the list and we will select blister as Point of Interest.
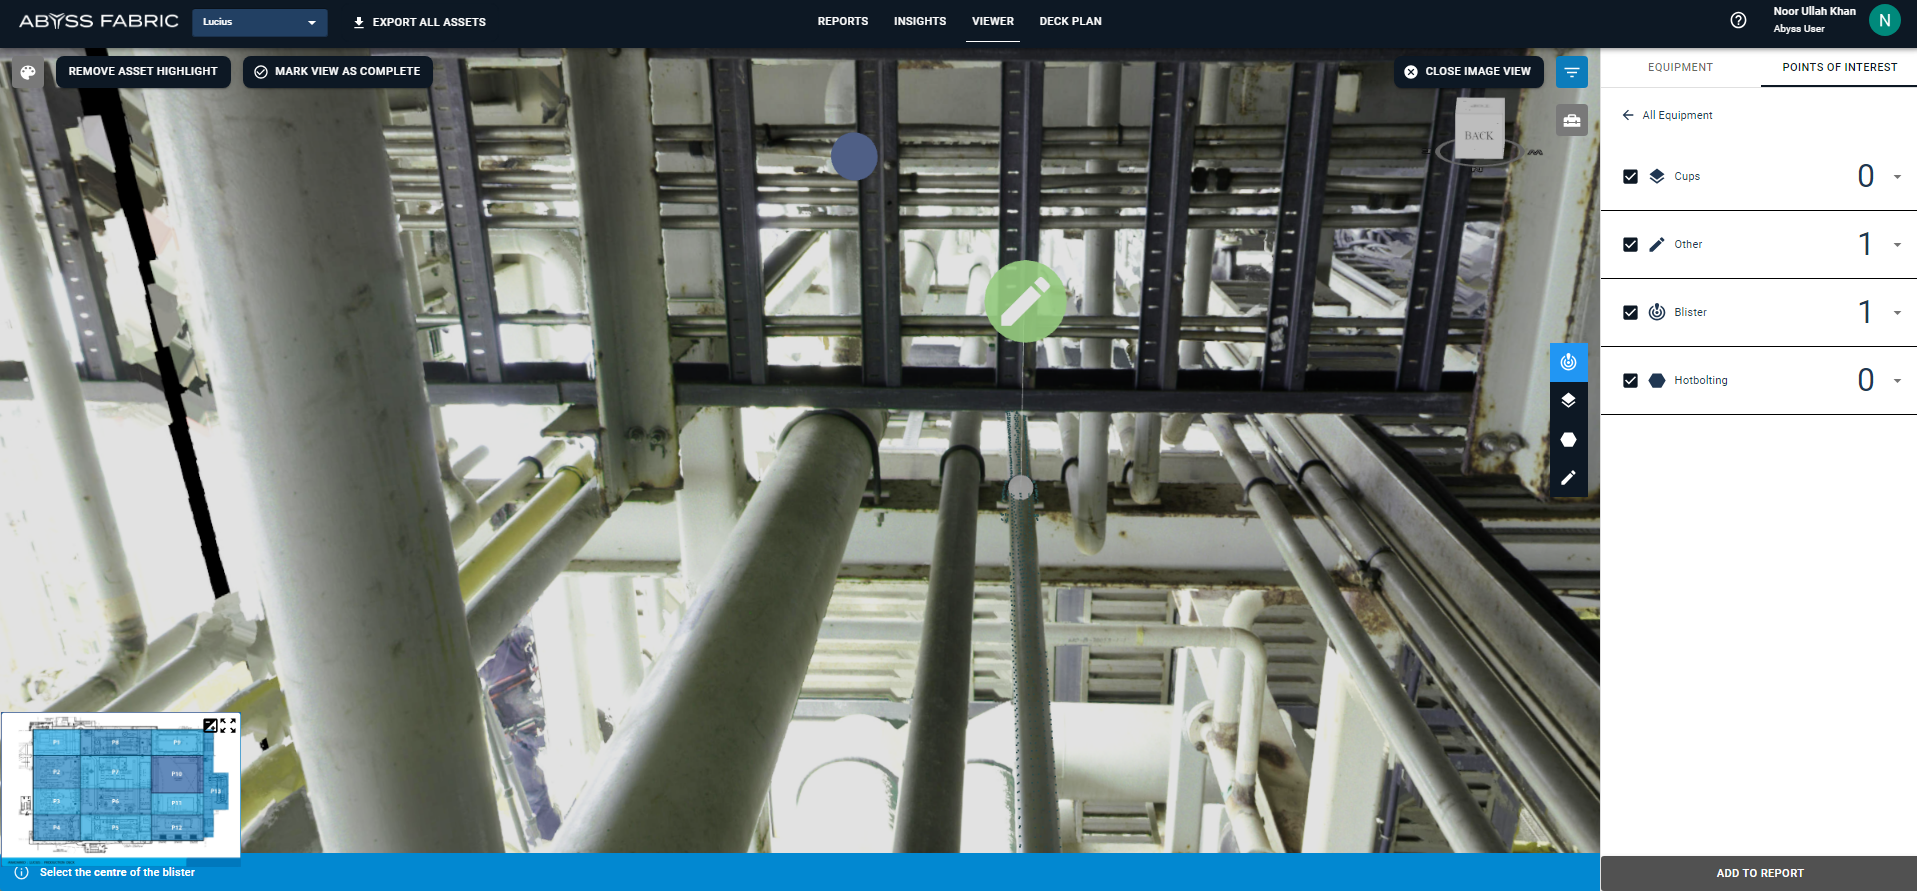
Blister to be selected in the Point of Interest
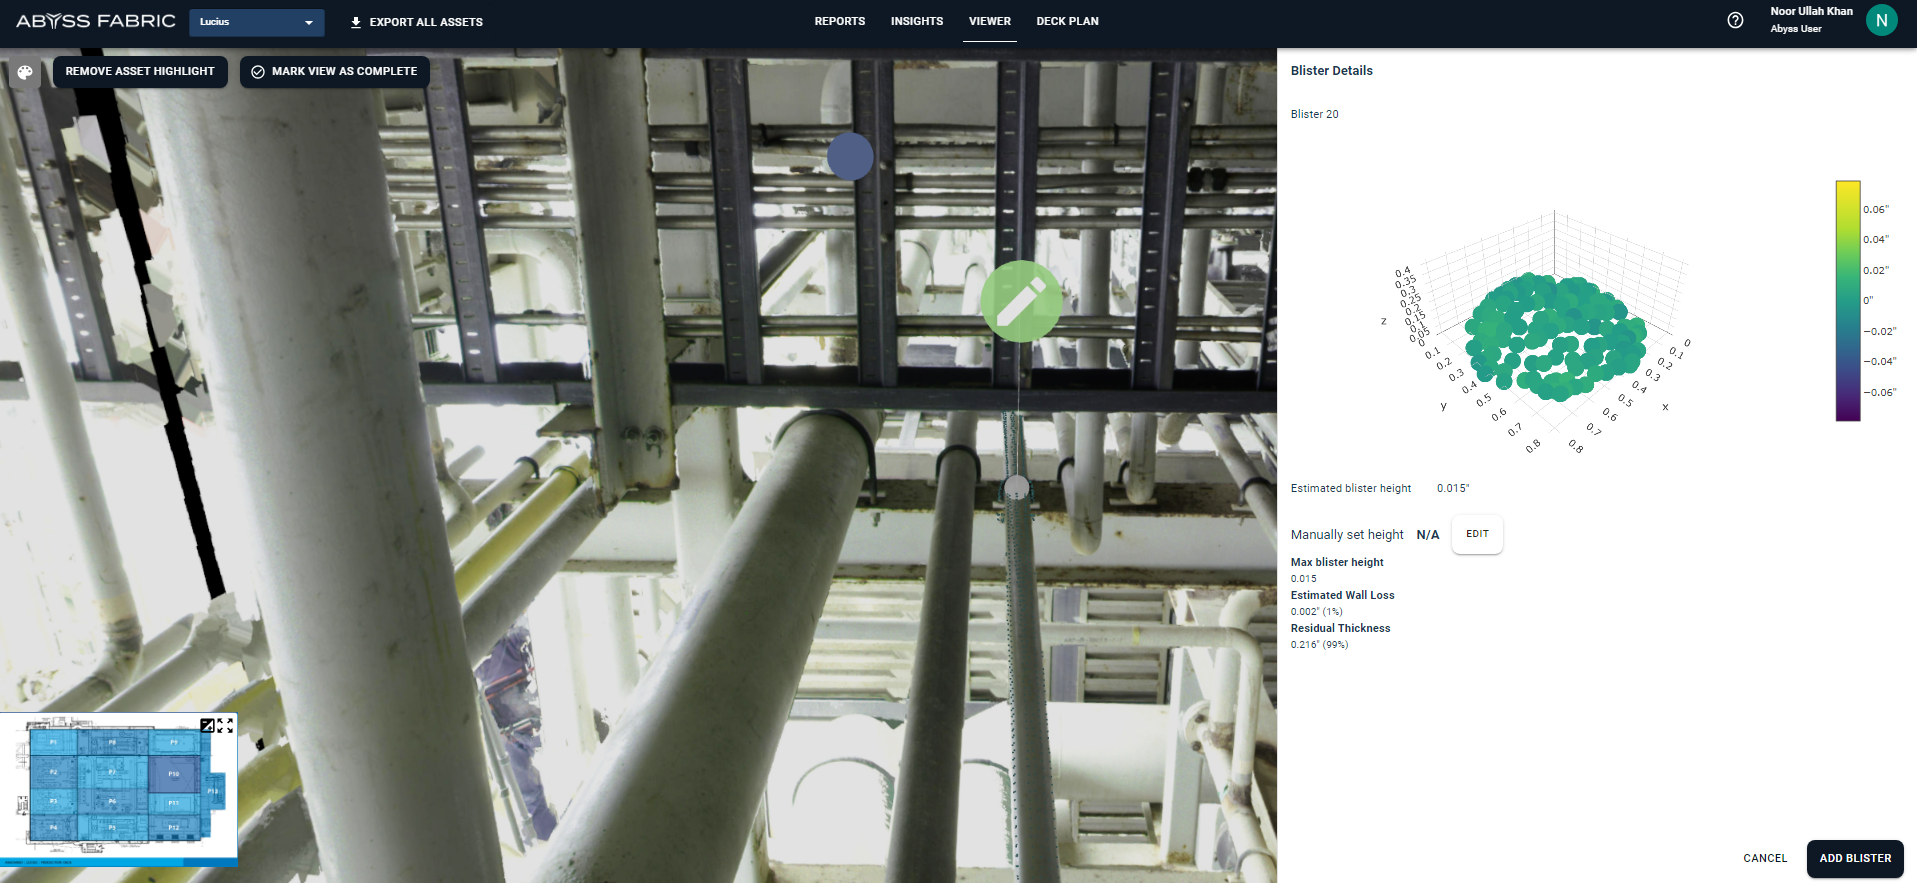
The Blister Detail panel will open up where the details of the blister from the blister height tool are added. The user has the option to also add manual blister height which will be recorded as well. Clicking on the Add Blister button will add a Point of Interest to the record.
ADD Remaining POI
Whenever the POI is created a message is mentioned in the bar below --- Success message fr creation and Deletion
Adding Point of Interest in the Report
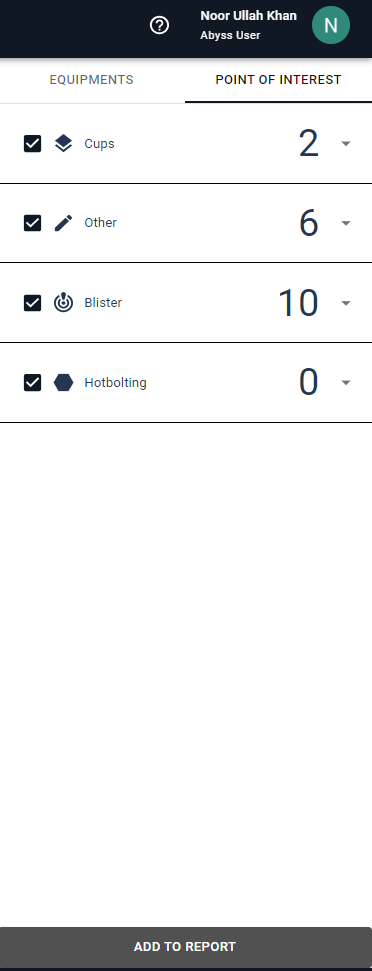
To access the required point of interest, navigate to the Point of Interest Panel for any equipment. If no equipment is selected, all points of interest assigned to the platform will be displayed.
The following steps are to be followed for the report:
Select the point of interest that needs to be added to the report
Click on the “Add to Report” button at the end of the panel
A pop-up window will appear displaying all selected points of interest.
The report can either be added to the already created report or a new report can be created.
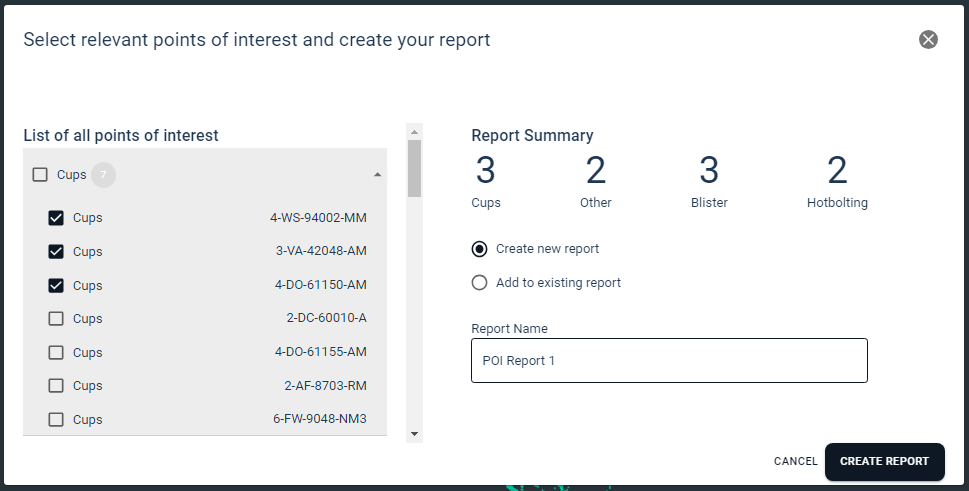
Adding a Point of Interest in an existing report, when selected the drop-down will show the reports that are available in unpublished status.
Only reports that are in unpublished status will be available for the Point of Interest to be added.
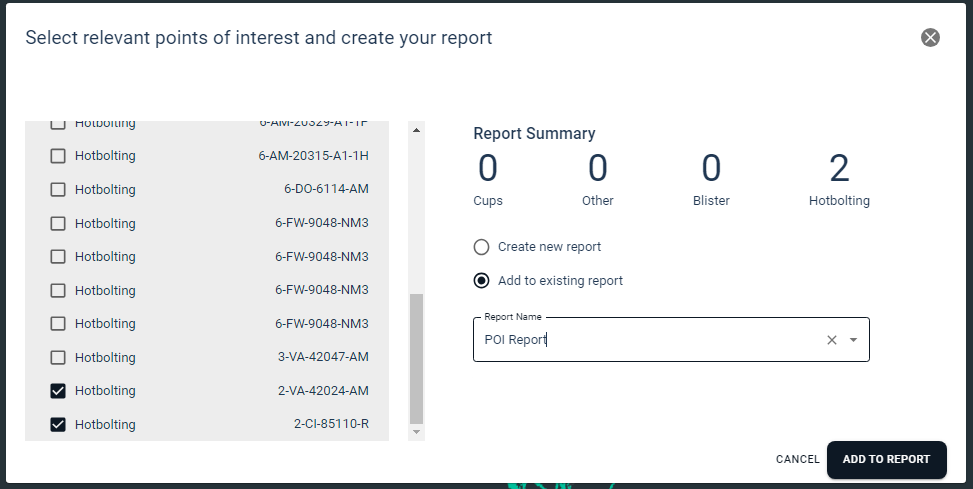
We can either select all the Points of Interest by clicking the top node or select the individual point of interest that is required for the report.
Reports
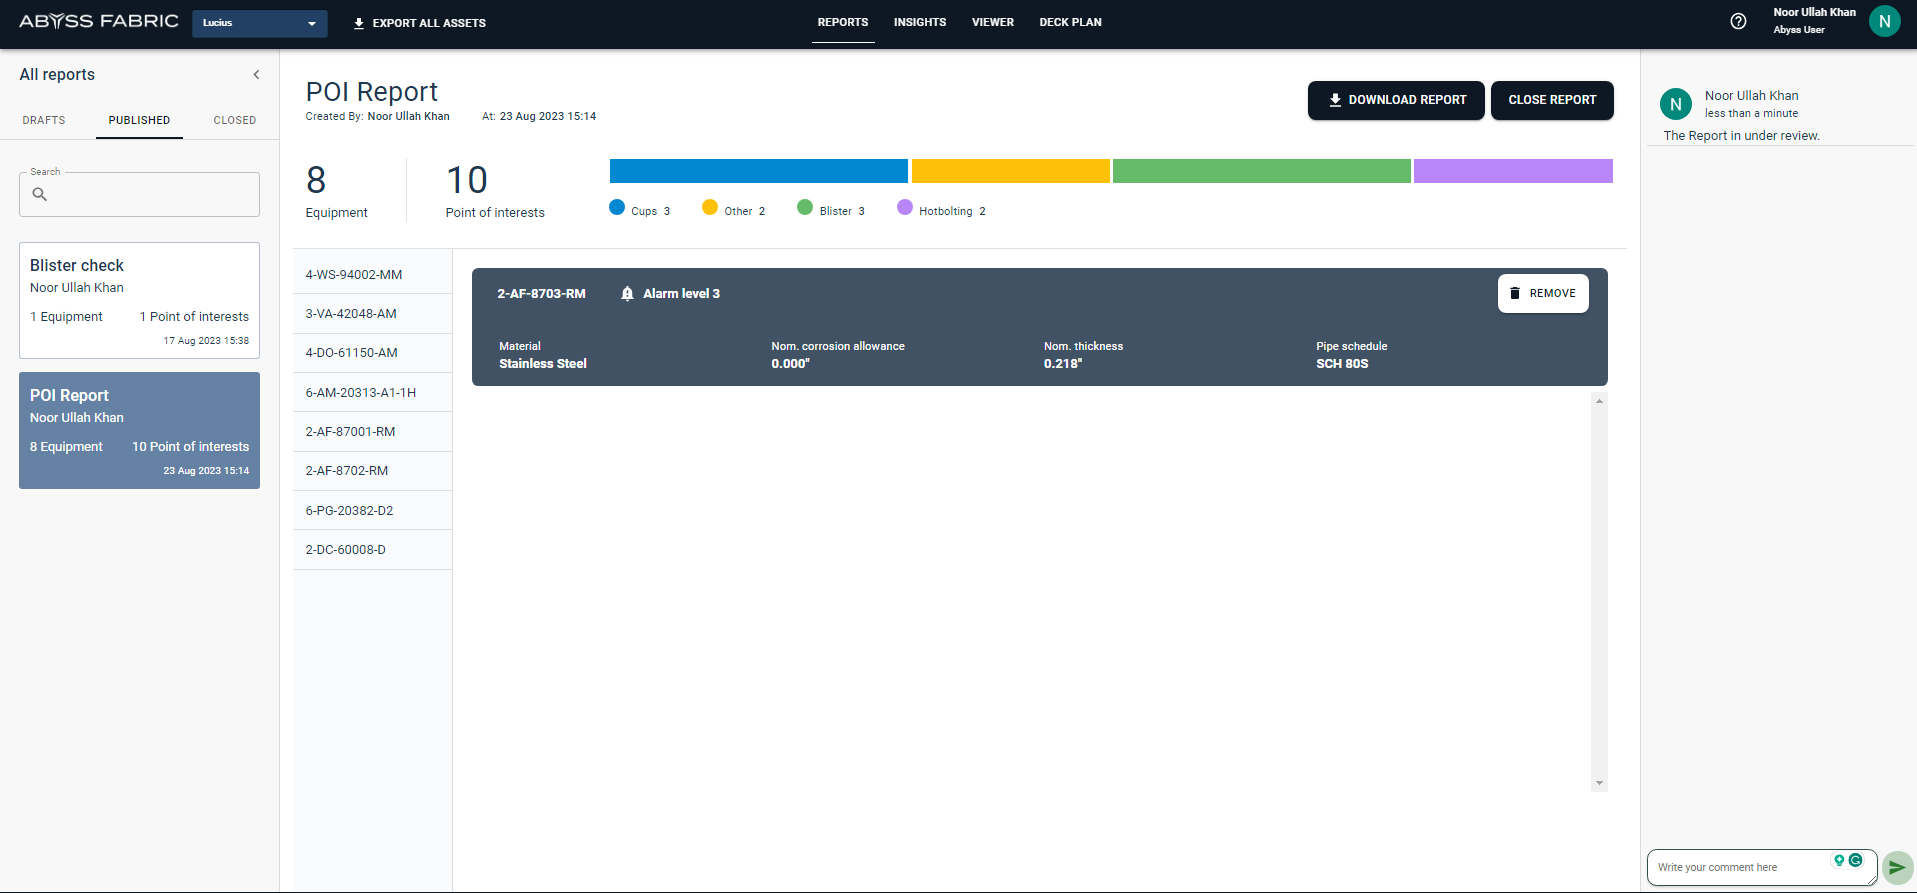
When the report has been processed as a new report, the report page will open. This page will have the selected report added in the draft section of the all report area.
The report has the following features shown as a summary.
Total number of equipment in the report
Total Points of interest in the report
Details of Points of interest with line representations
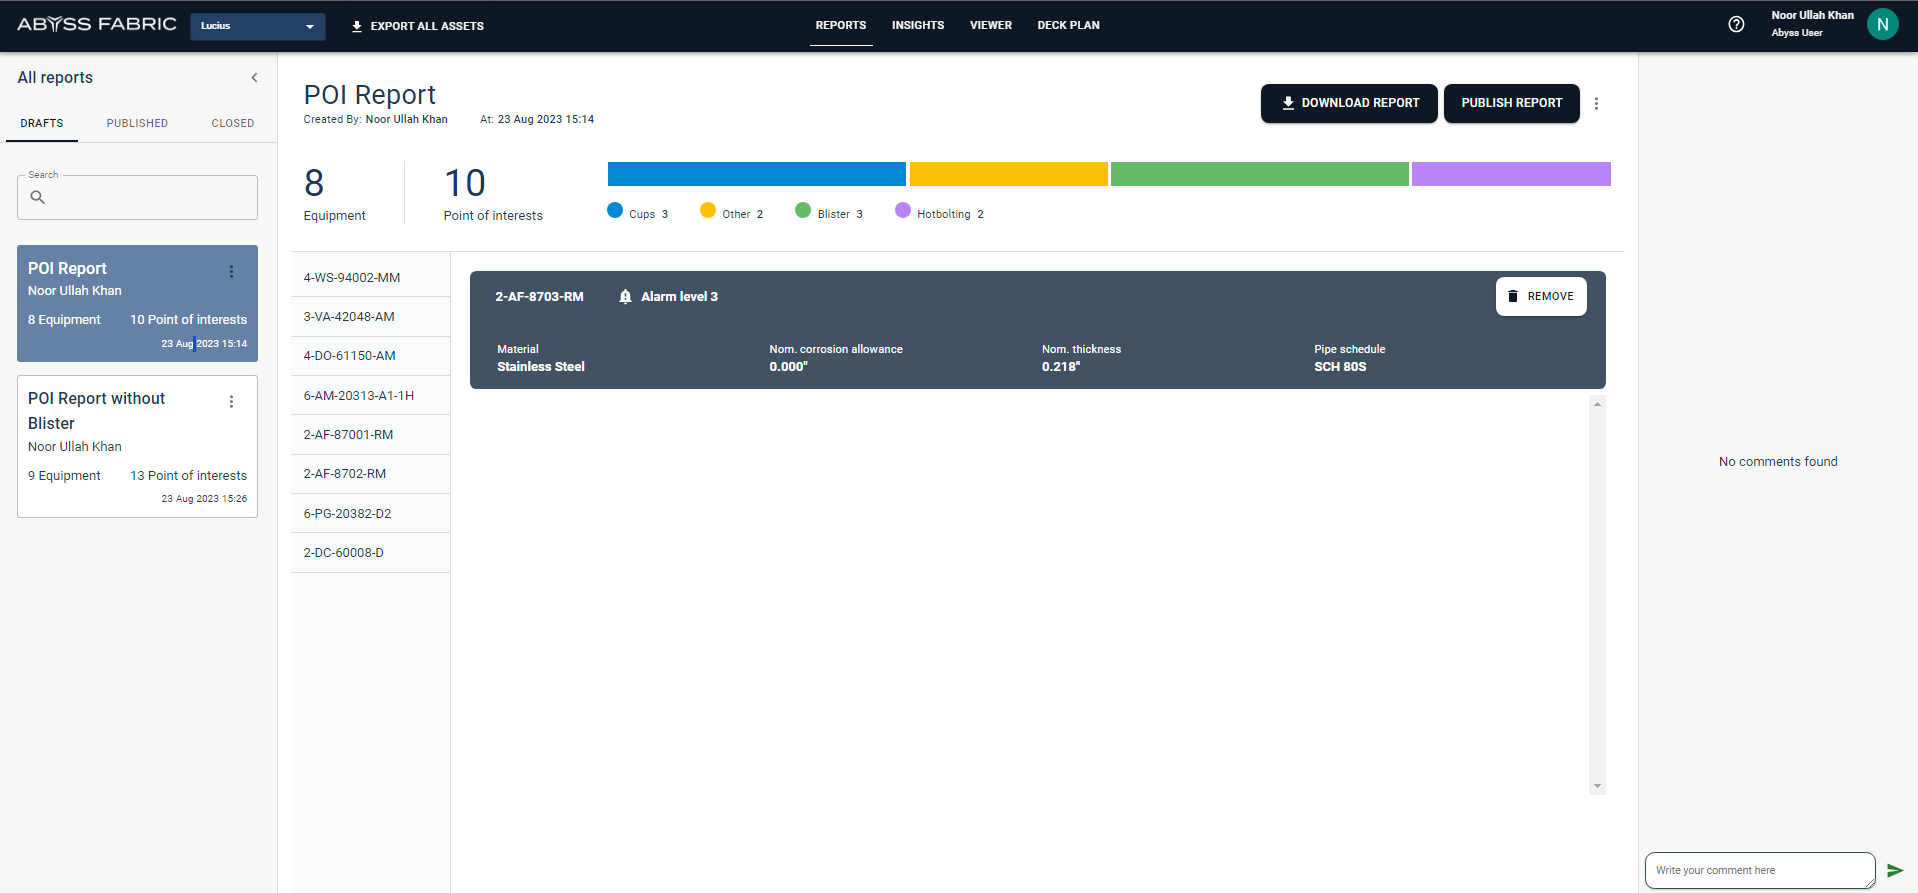
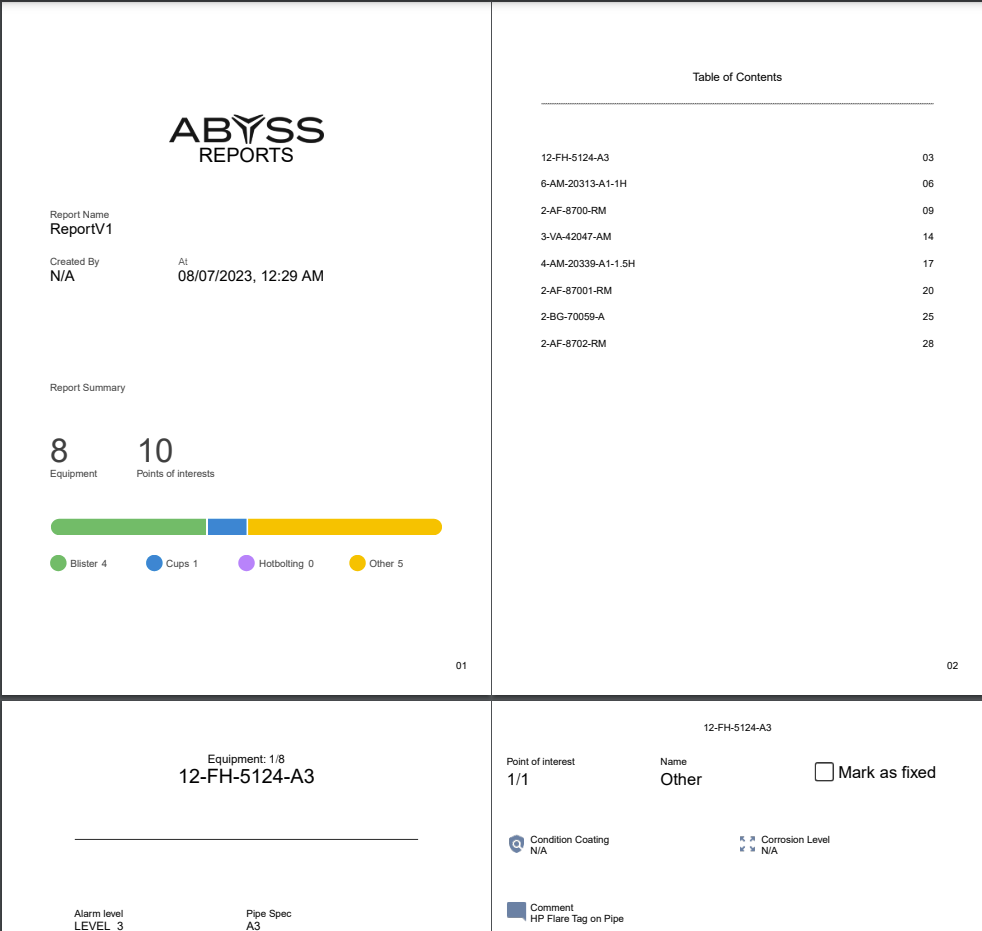
The report can be edited in the draft area, and any Point of interest can be removed. The report can also be downloaded, published, or deleted.
The report will have the following information added to it.
Material
Corrosion Allowance
Thickness
Pipe Schedule
Point of Interest Type
Corrosion Level
Coating Condition
Please note that the details of these options may change depending on the equipment selected in the report.
While in the reports you can add comments in the report. The comments are added to the specific report only.
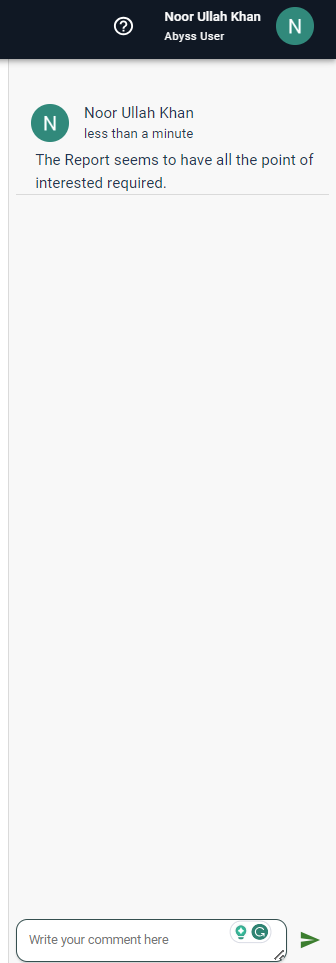
The comments can be added to the report under review.
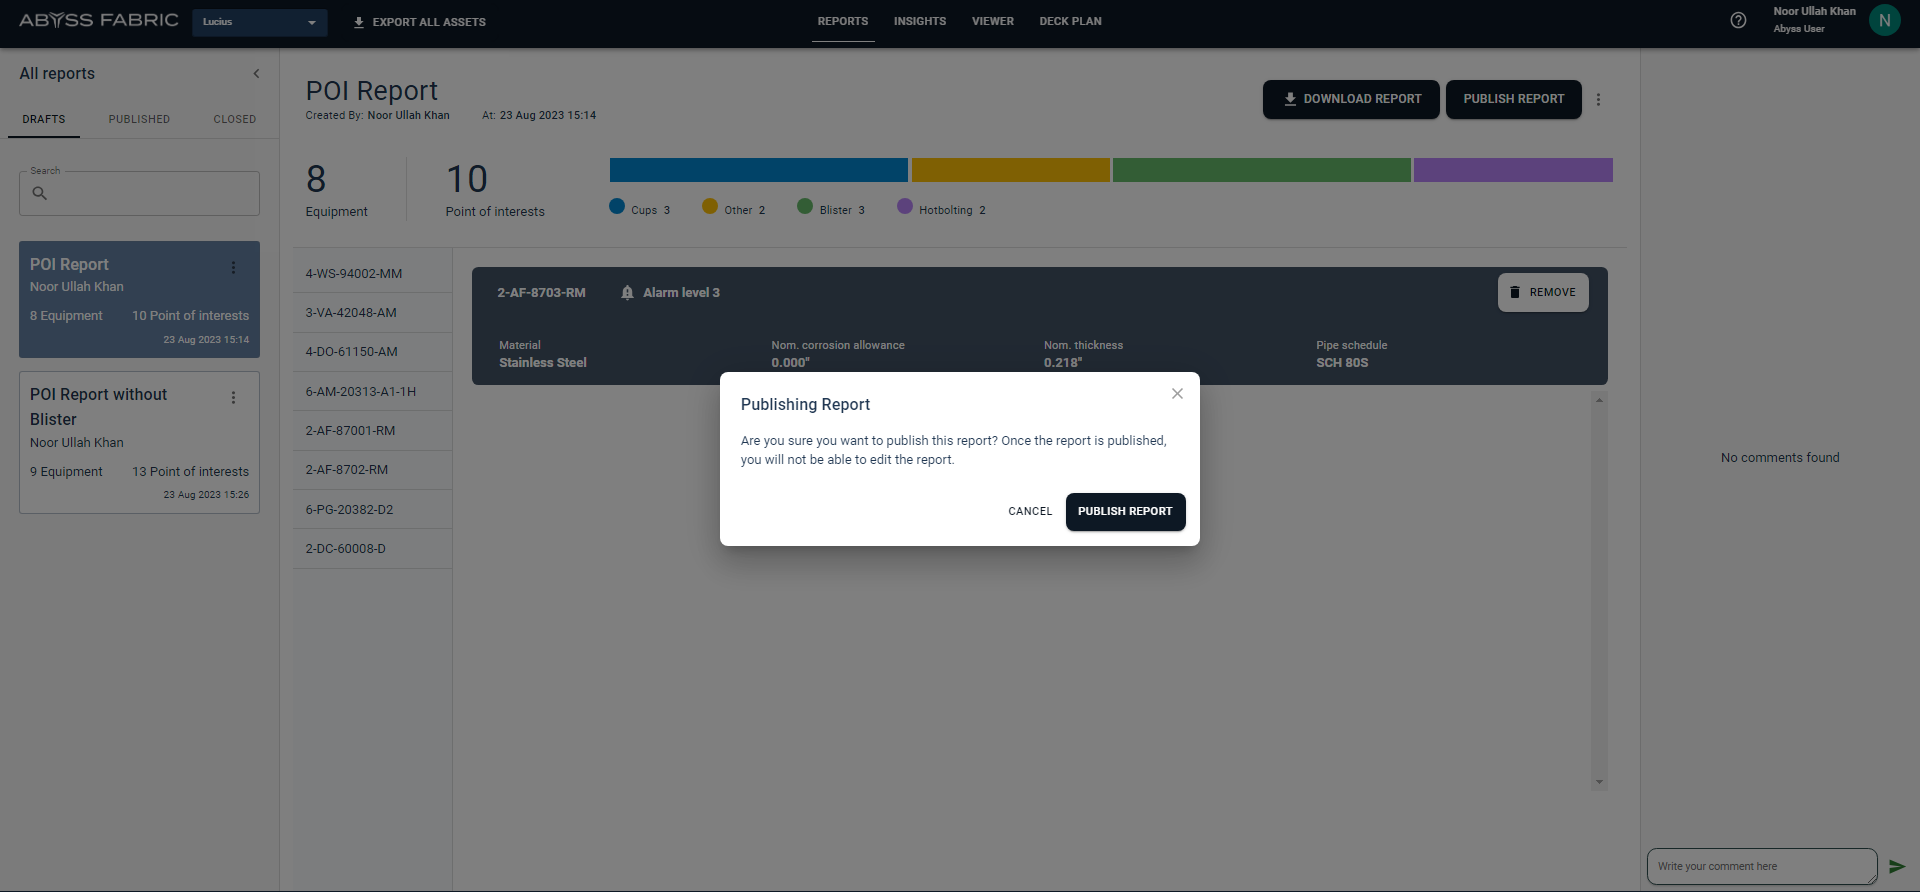
When the Published Report is clicked a pop-up will appear asking for the confirmation for publishing. Once the report has been published the report will not be editable.
Comments can be added to the report
Deck Plan
The deck plan shows the different
Deckplan Selector
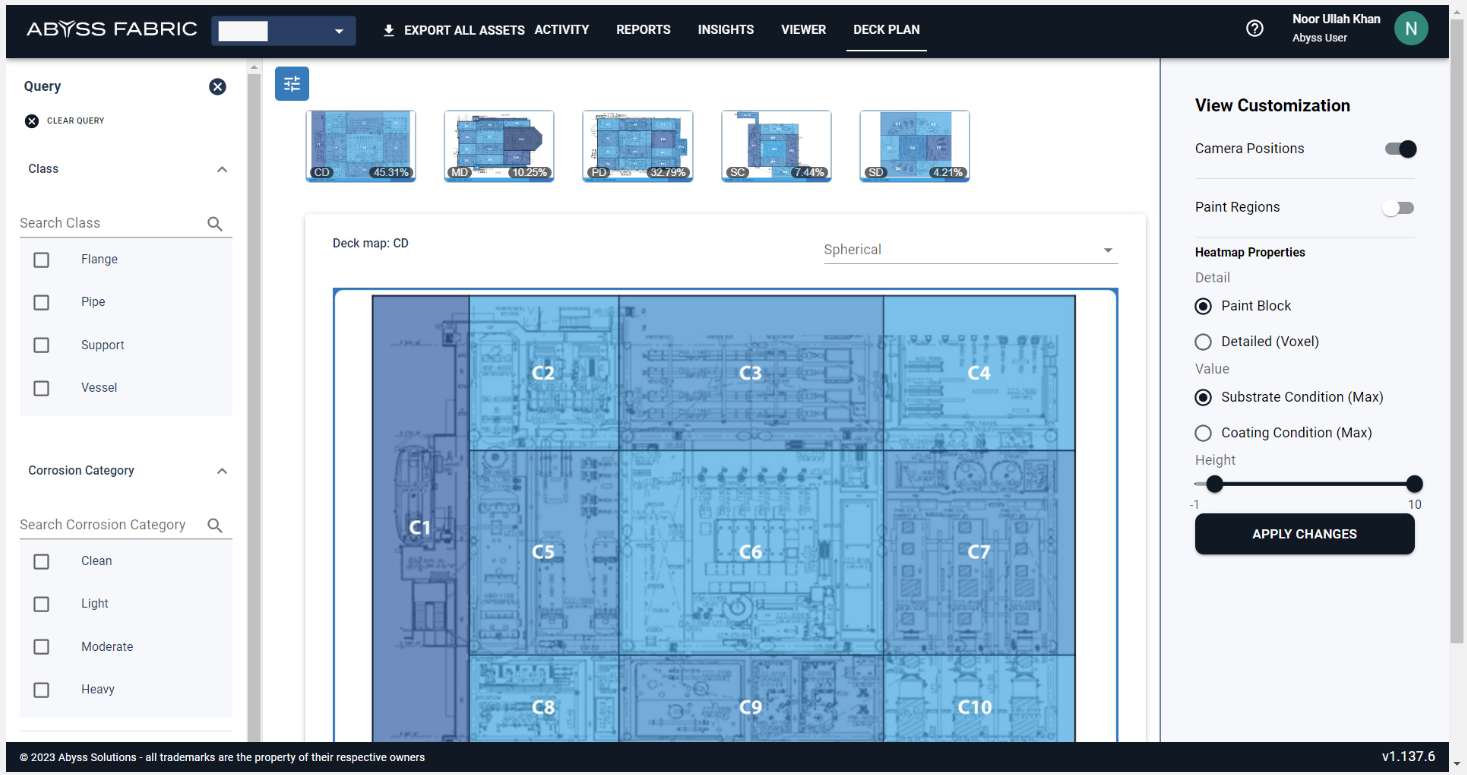
To select a deck, you can use the decks available in the top section of the deck plan. By changing the selected deck, you can limit the displayed diagram to only show information related to that specific deck.

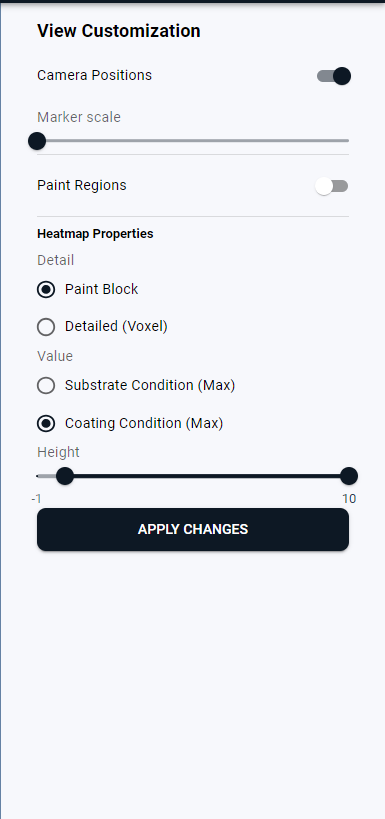
View Customization
This part covers how the user would see the details as shown in the Deck Plan, the following are the major features that impact how the deck plan is highlighted
Selecting a Location
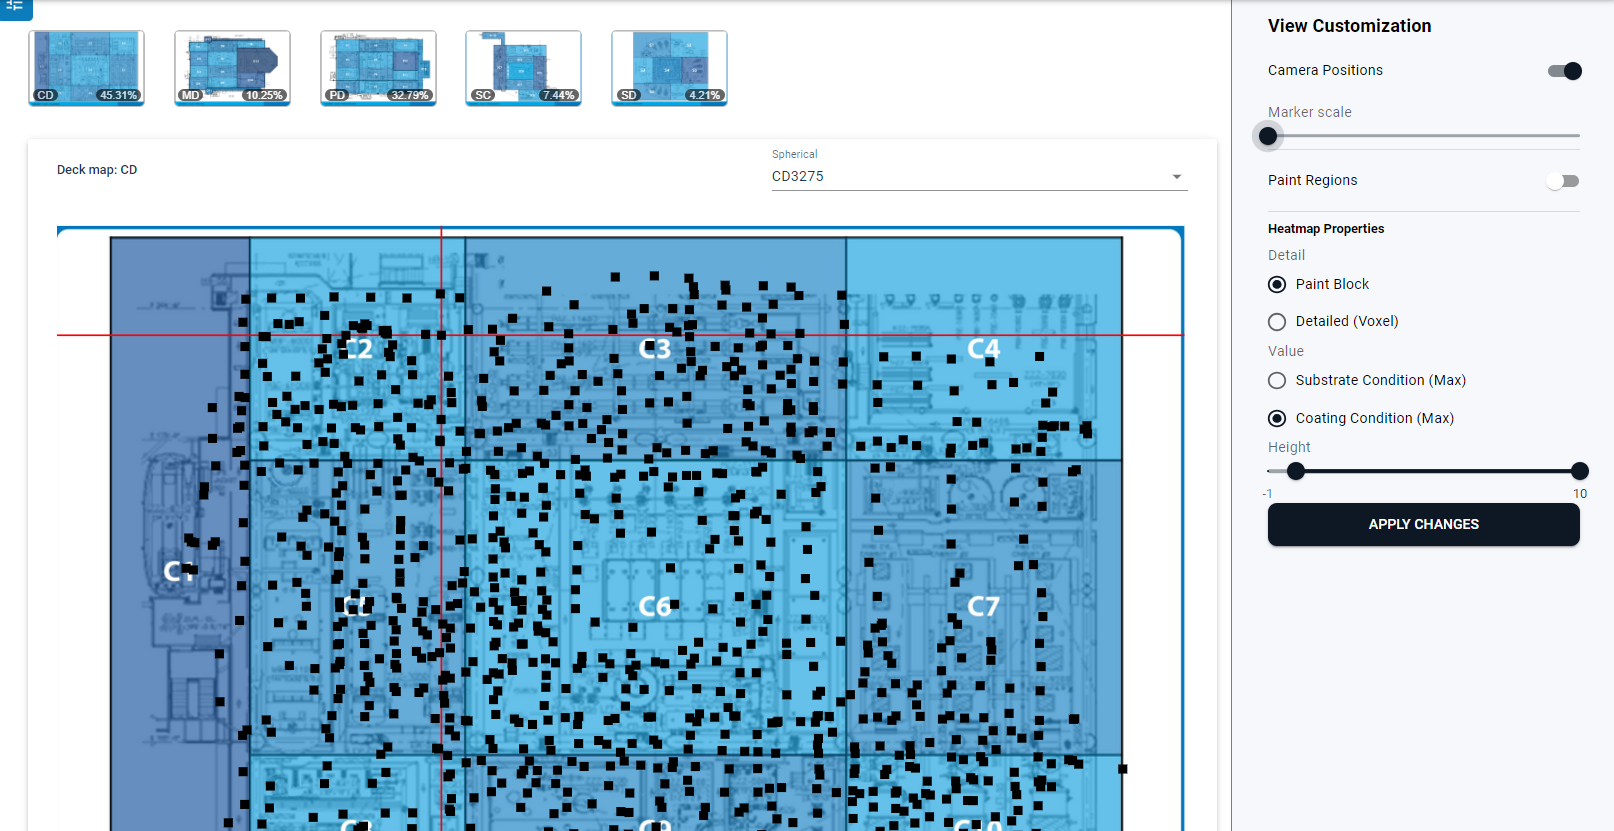
To select a location on the deck plan, simply click on one of the markers displayed.
Marker size
You can control the size of the markers using a slider.
Marker Size at the minimum value
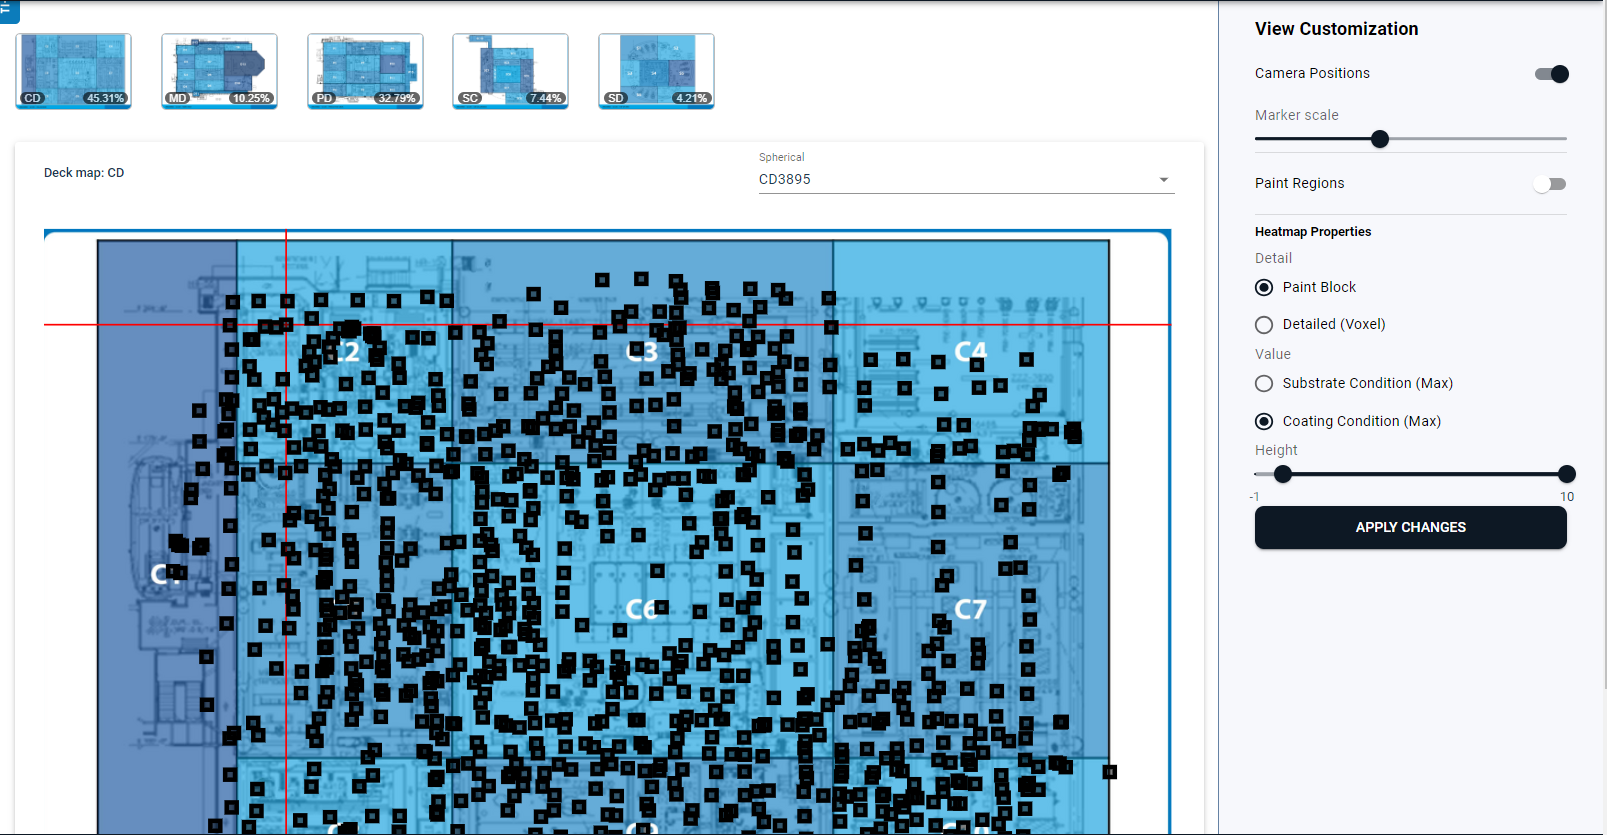
Marker Size at the increased value
Paint Regions
To enhance your experience, we have introduced a feature that allows you to assign paint to the deck plan. There are two types of assignments available: Outlined and Filled. Below are the variations shared:
Outlined
Filled
With this feature, you can easily customize your deck plan and make it look more appealing. Try it out now!
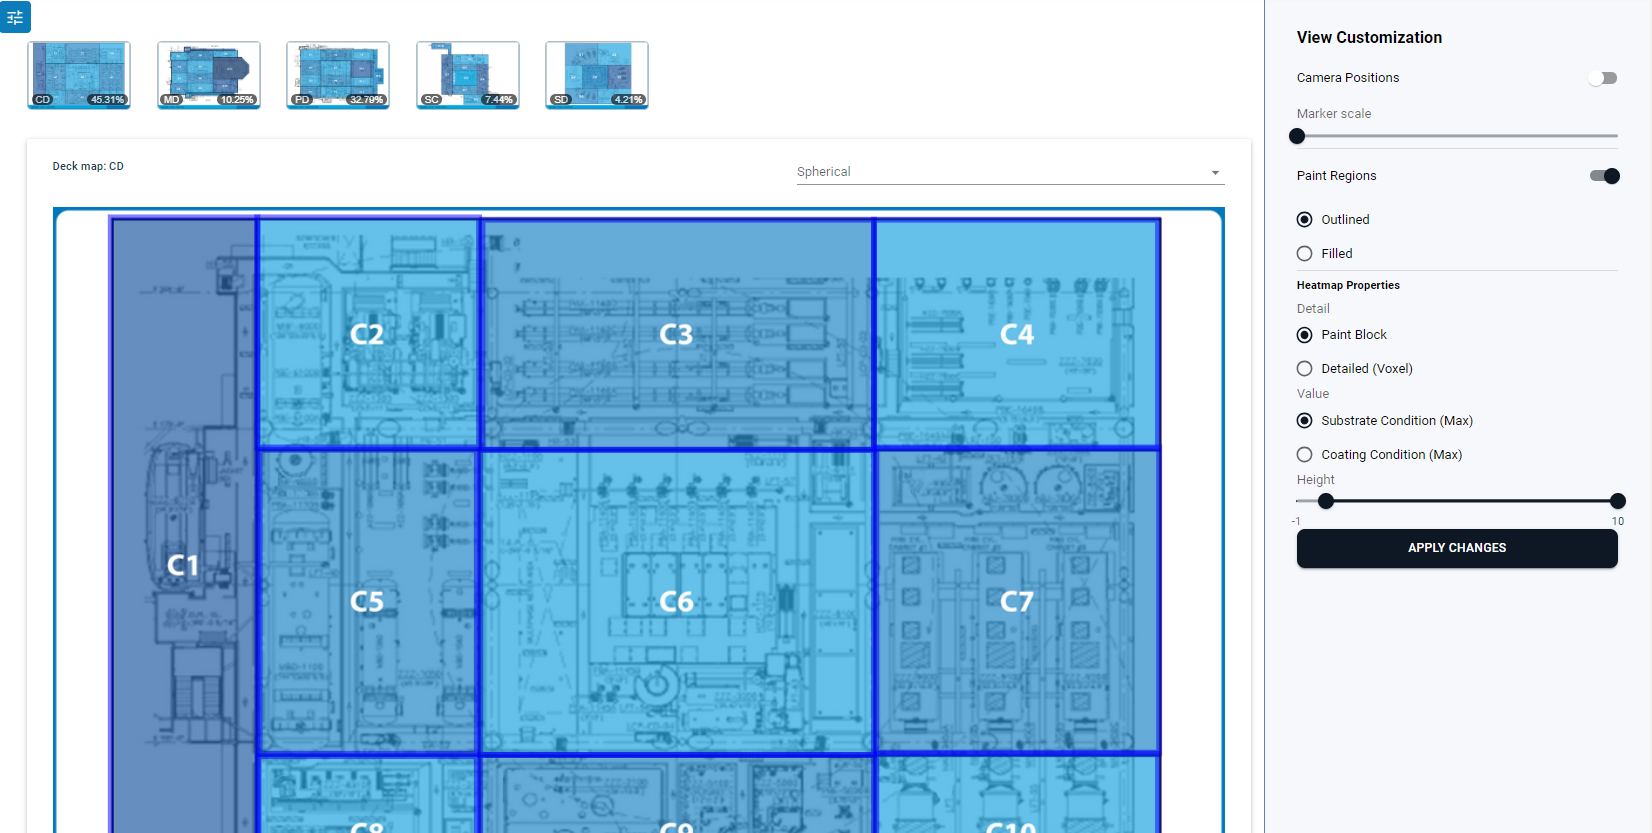
Paint Region Outline
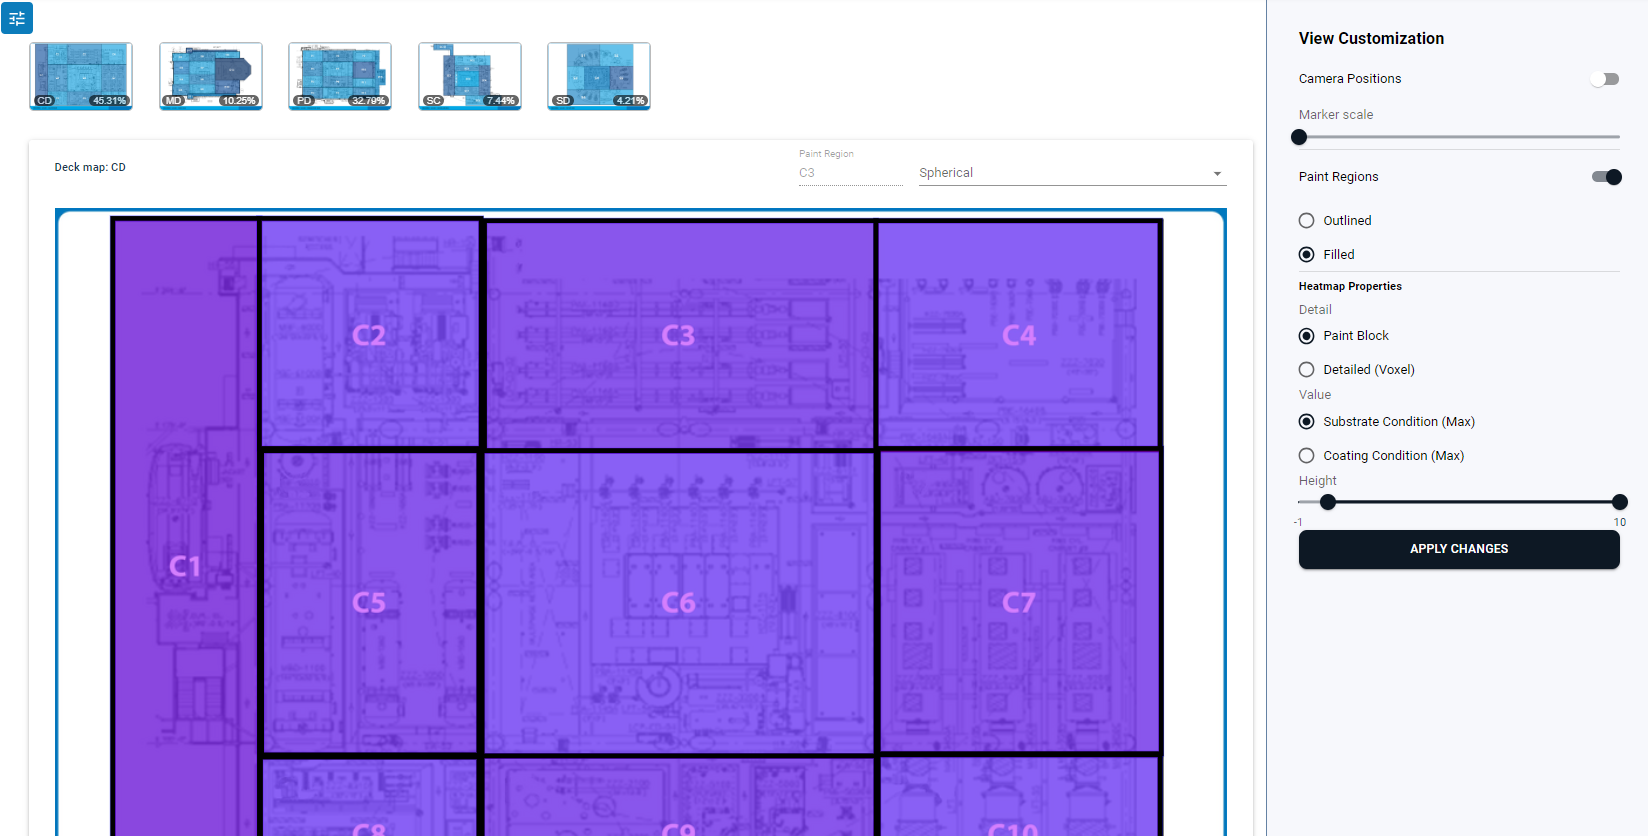
Paint Region Filled
Heatmap
The feature will enhance the deck plan by highlighting it with the required information. The following options are available for Heatmap properties:
Paint Block
Detailed Voxel
Values that can be shown on the heatmap include:
Substrate Conditions (Corrosion)
Coating Conditions
POI heatmap
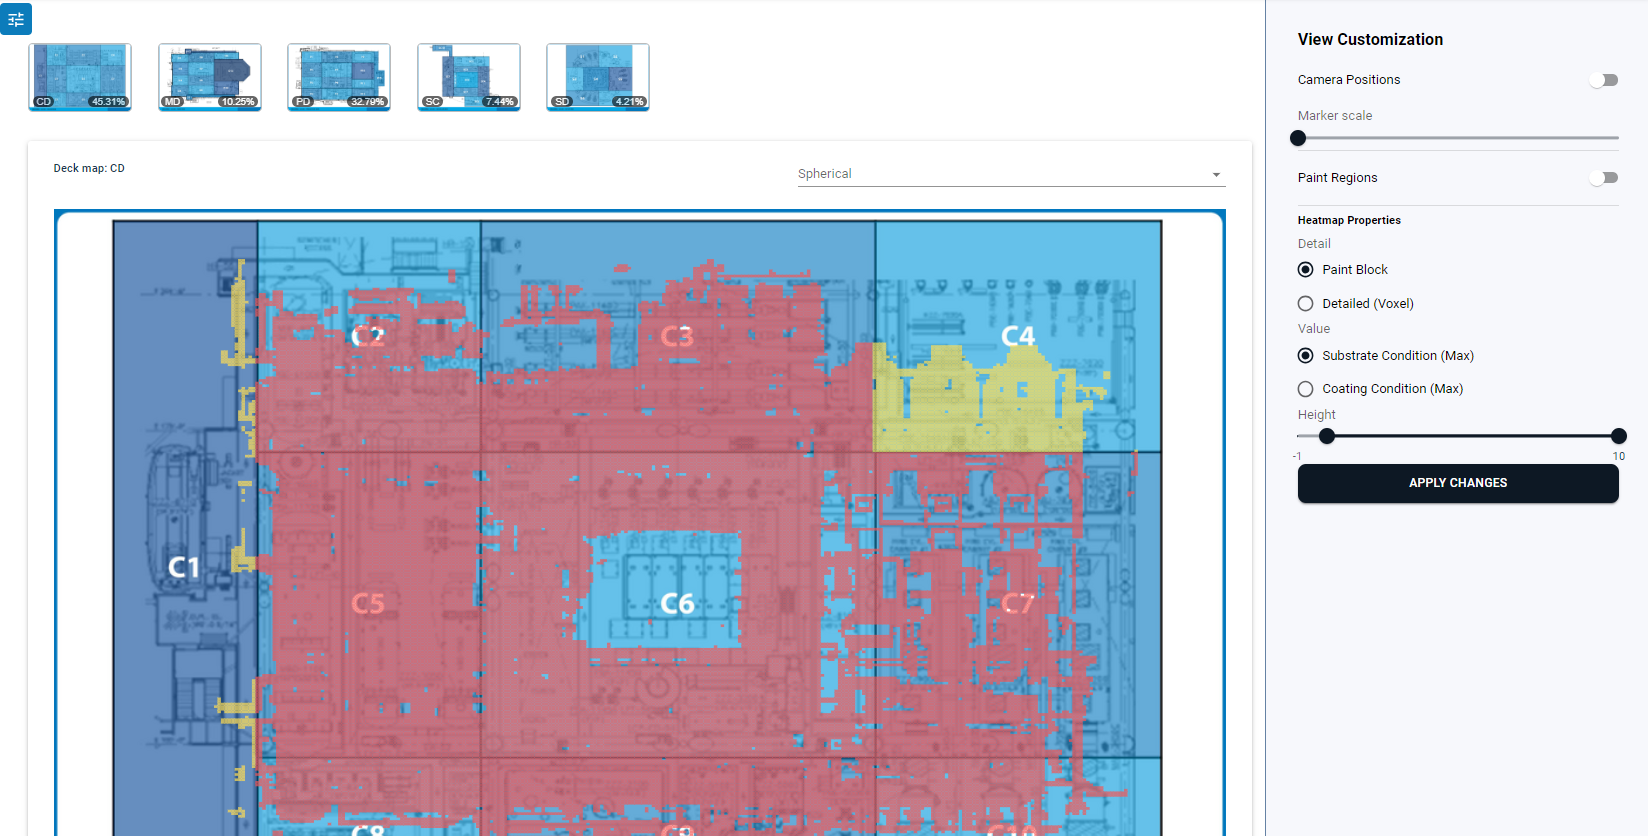
Heatmap Paint Block - Substrate Condition
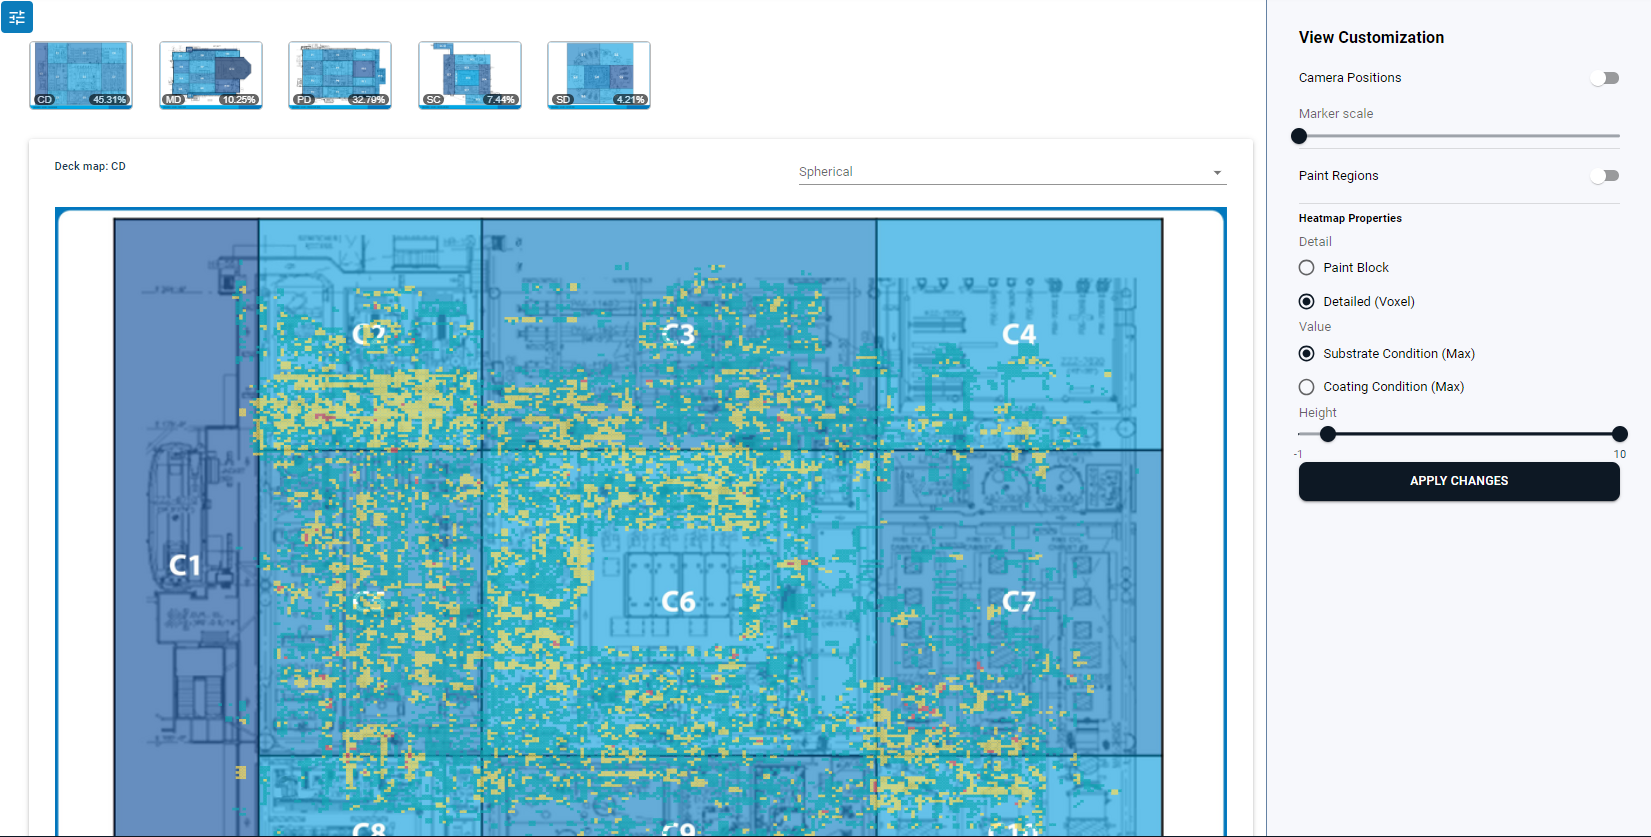
Heatmap Detailed - Substrate Condition
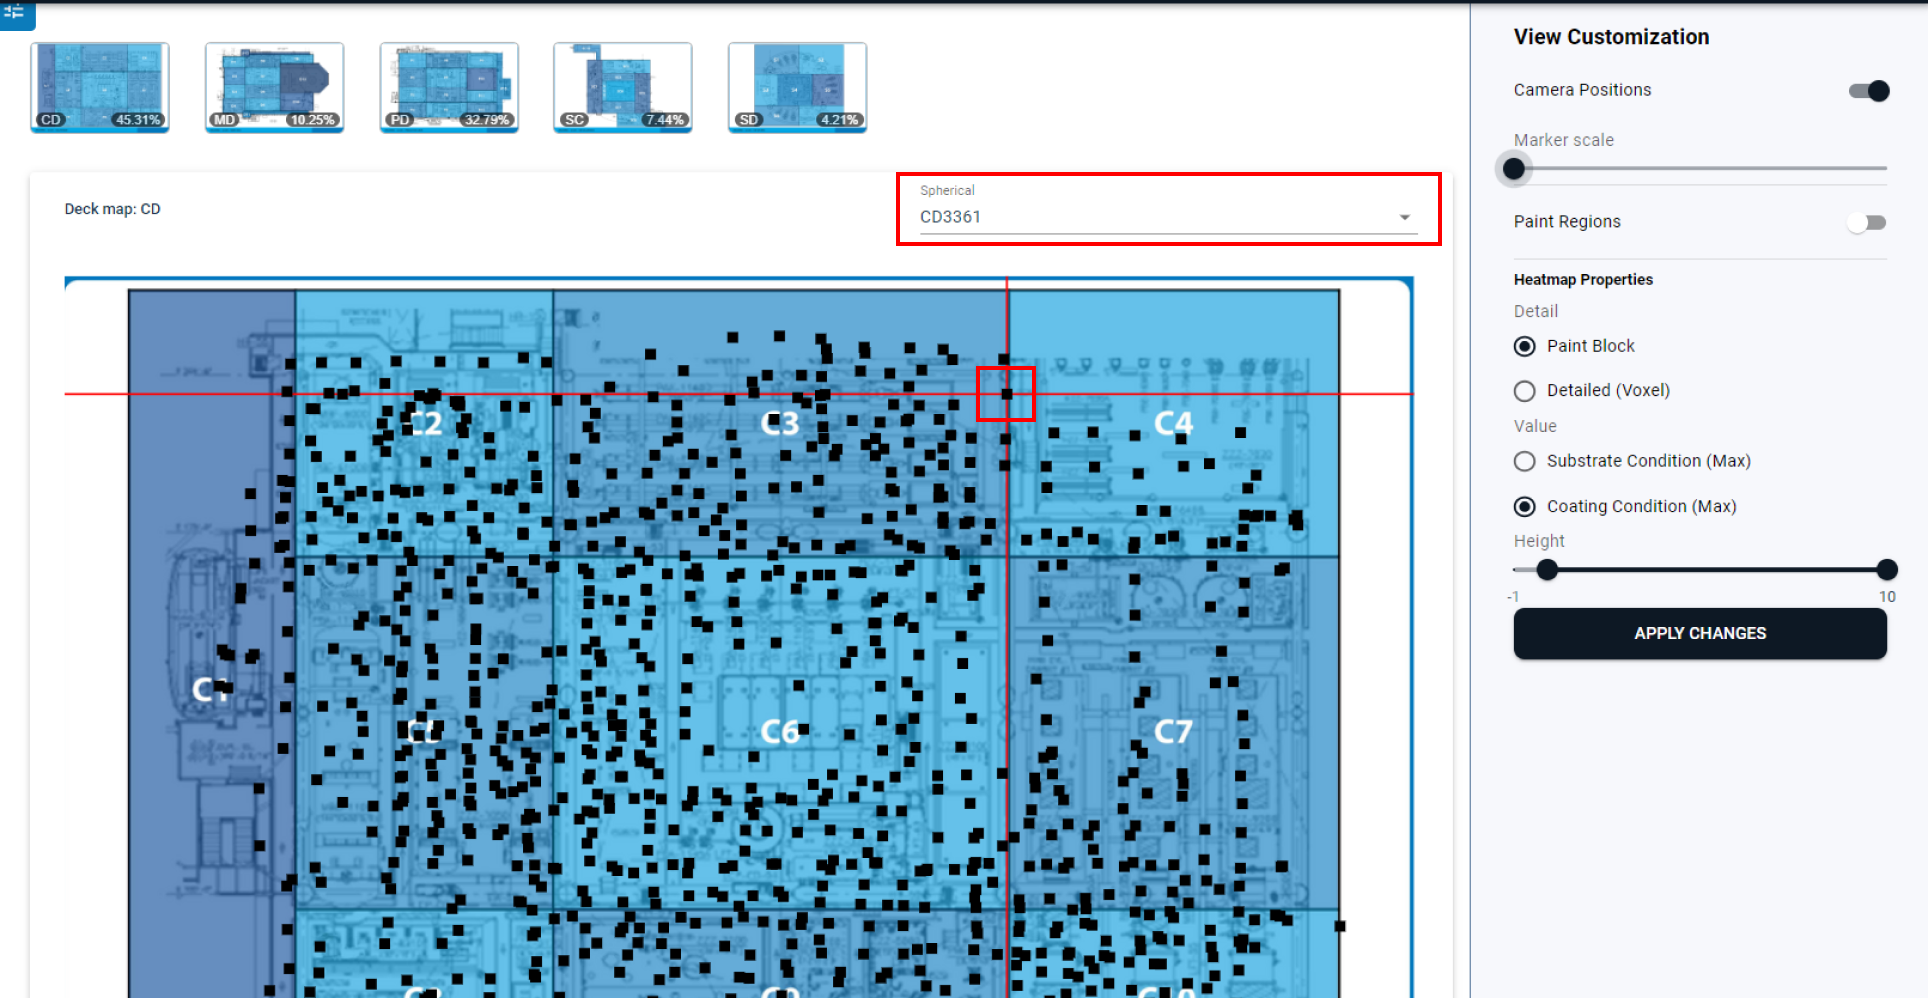
Camera Position
When using this tool, it's important to note that whenever you hover your cursor over a camera position point, the corresponding spherical will be replaced in the spherical drop-down menu.
To make things easier for users, when you place your cursor on a specific camera point, that point will be highlighted. This can help you keep track of which camera position you are currently working with.
If you prefer to select your spherical from the drop-down list or search it instead of hovering over each camera position, that's no problem! Simply choose your desired spherical from the list or search it and that camera position will be highlighted in the deck plan.
Query in Deckplan
The user can perform query functions using different options available. The class section of the query will highlight the respective class items in the deck plan. Class includes the following, Flange, Pipe, Support & Vessel.
